
Report Builder
Build PDF reports from your sensor data, delivered on schedule
The Datacake Report Builder turns device data into finished documents. Drag KPIs, charts and tables onto a page, choose the devices, set a schedule, and every recipient gets the report by email: as a PDF, an interactive web view or both.
- Drag-and-drop editor with KPI, chart and table widgets
- Daily, weekly or monthly schedules with email delivery
- PDF document, interactive web view or both
- Ready-made templates for cold chain and energy reports
From monitoring data to a document people actually read
Dashboards are for the people who run the system. Everyone else (customers, managers, auditors, building owners) wants a document in their inbox. The Report Builder produces that document from the same device data: you design the layout once, and the schedule takes care of the rest.
Meet the Report Builder
Prefer watching to reading? This short intro video walks you through the Report Builder.
Pressing play loads the video from YouTube.
Widgets
KPIs, charts and tables from any device field
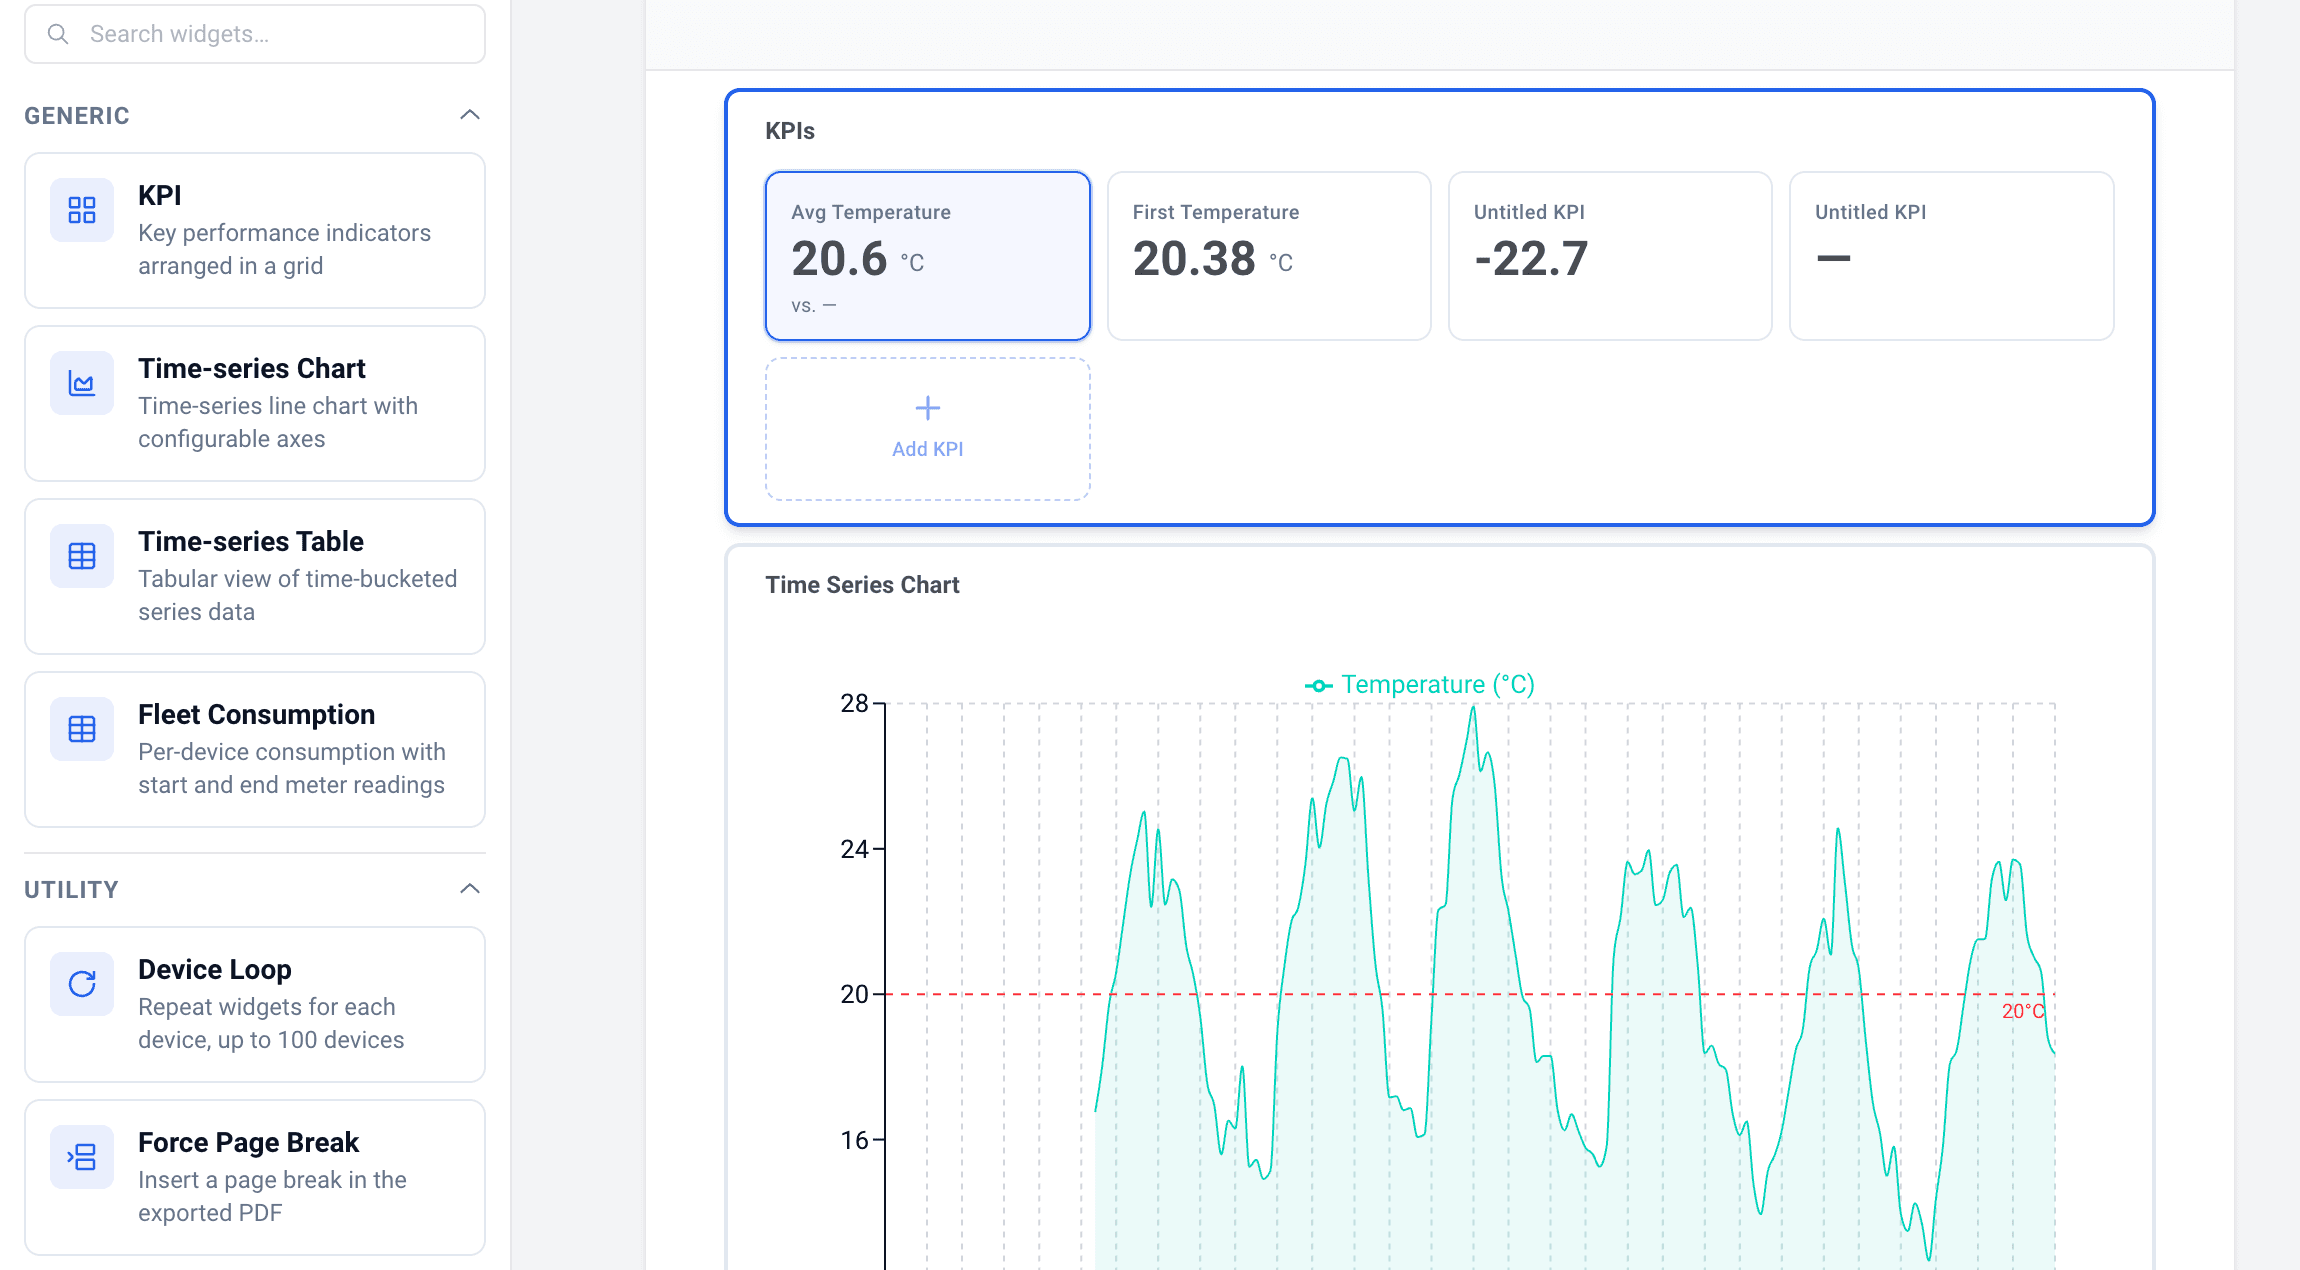
A report is a page of widgets. Pick one from the library, drop it on the canvas and choose the field, the aggregation and whether it covers a single device or the whole fleet. The built-in preview shows the layout while you work.
- KPI: average, minimum, maximum or sum over the report period
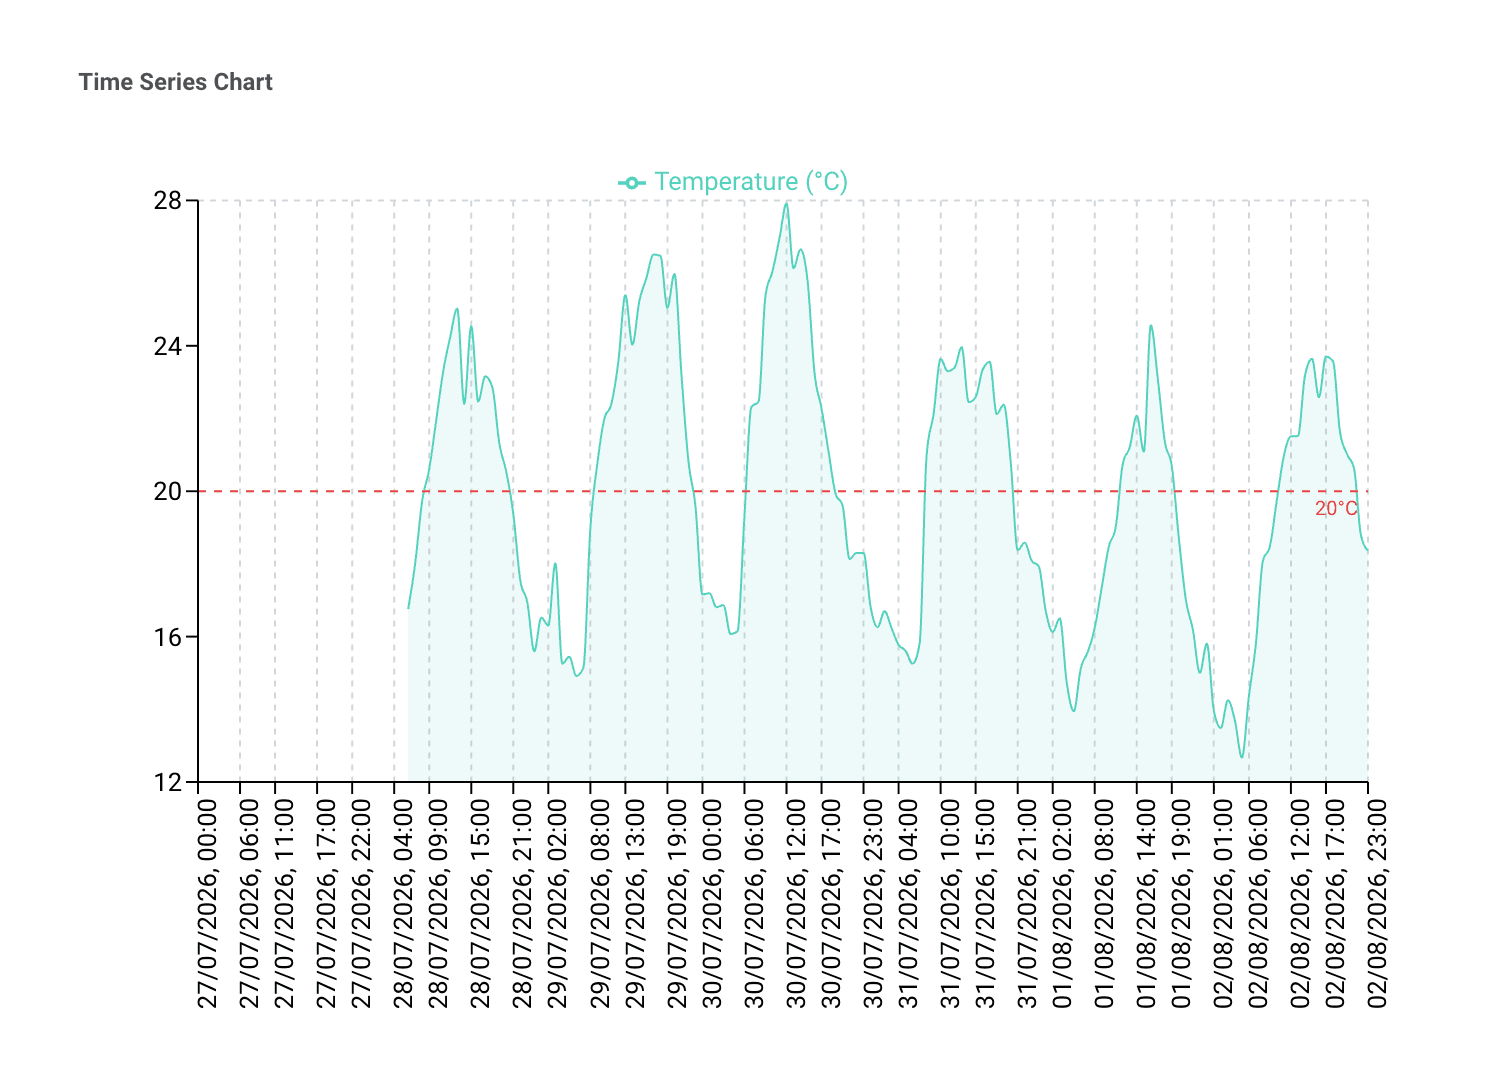
- Time-series chart as line, area or bar
- Time-series table at the resolution you choose
- Fleet Consumption: start and end meter readings per device
Device Loop
Design one section, repeat it for every device
Put a heading, a KPI summary, a chart and a table inside a Device Loop and the Report Builder generates that block once per device. Rooms, fridges, meters or machines all get the same consistent layout without building the section again and again.
- Up to 100 devices per loop
- Device header with name, serial number and location
- New devices with a matching tag are included automatically
Device Hierarchy
Group devices by building, floor and room
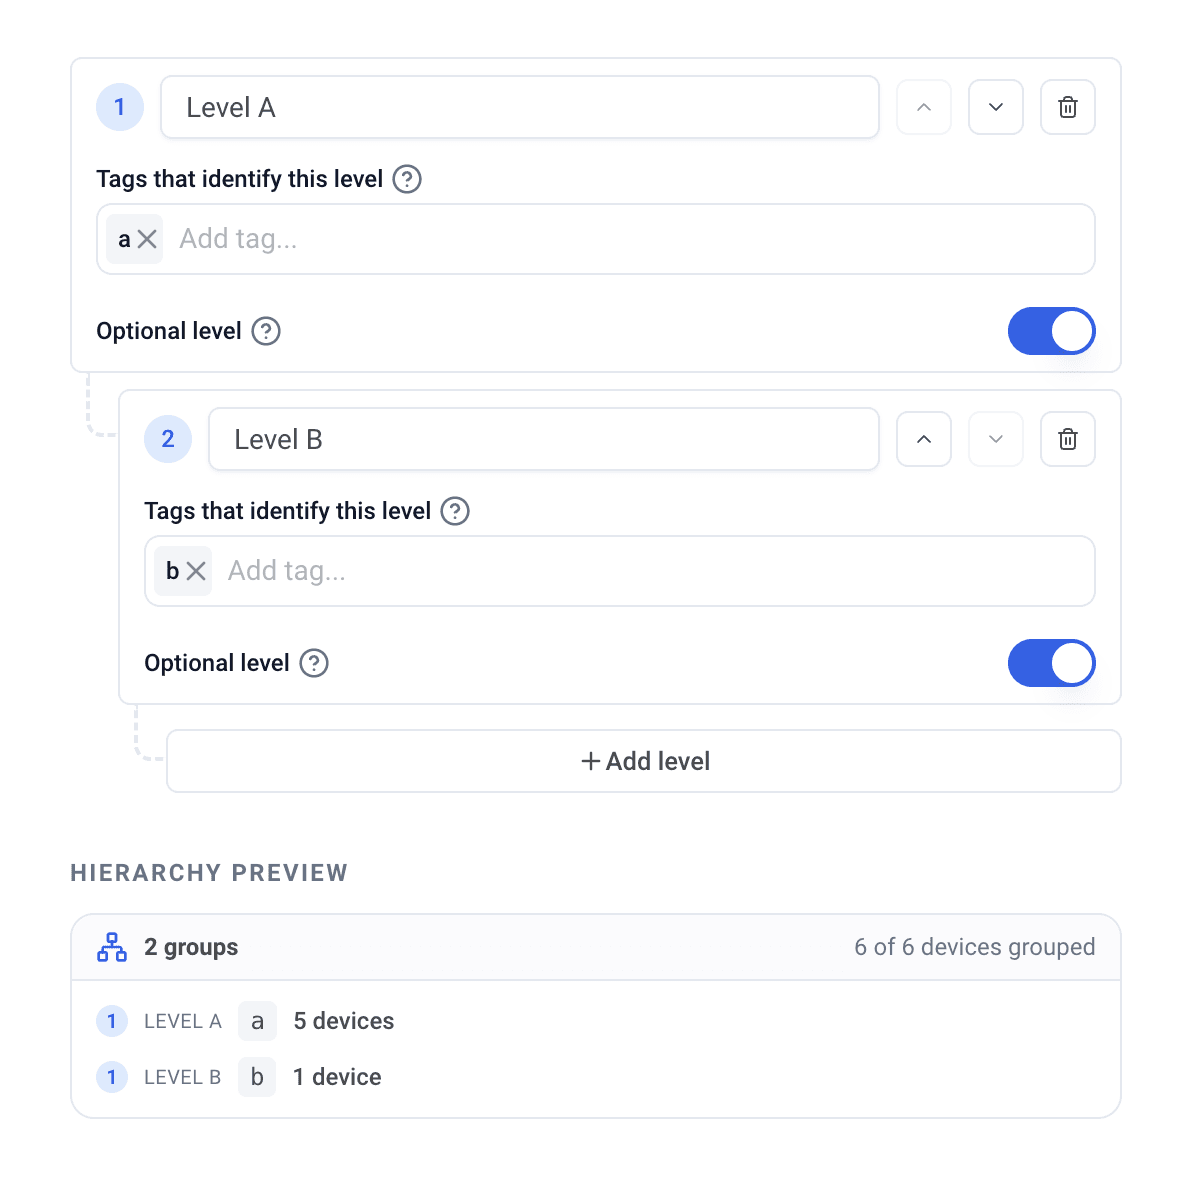
Larger installations rarely read well as one flat device list. Define hierarchy levels from the tags your devices already carry, and supported widgets group and roll up their values per level. A preview shows how many devices match before you apply the change.
- Levels such as Building, Floor and Room, defined by tags
- Optional levels keep devices without a matching tag
- Preview lists unmatched devices before anything is saved
Schedule & Period
Daily, weekly or monthly, in your time zone
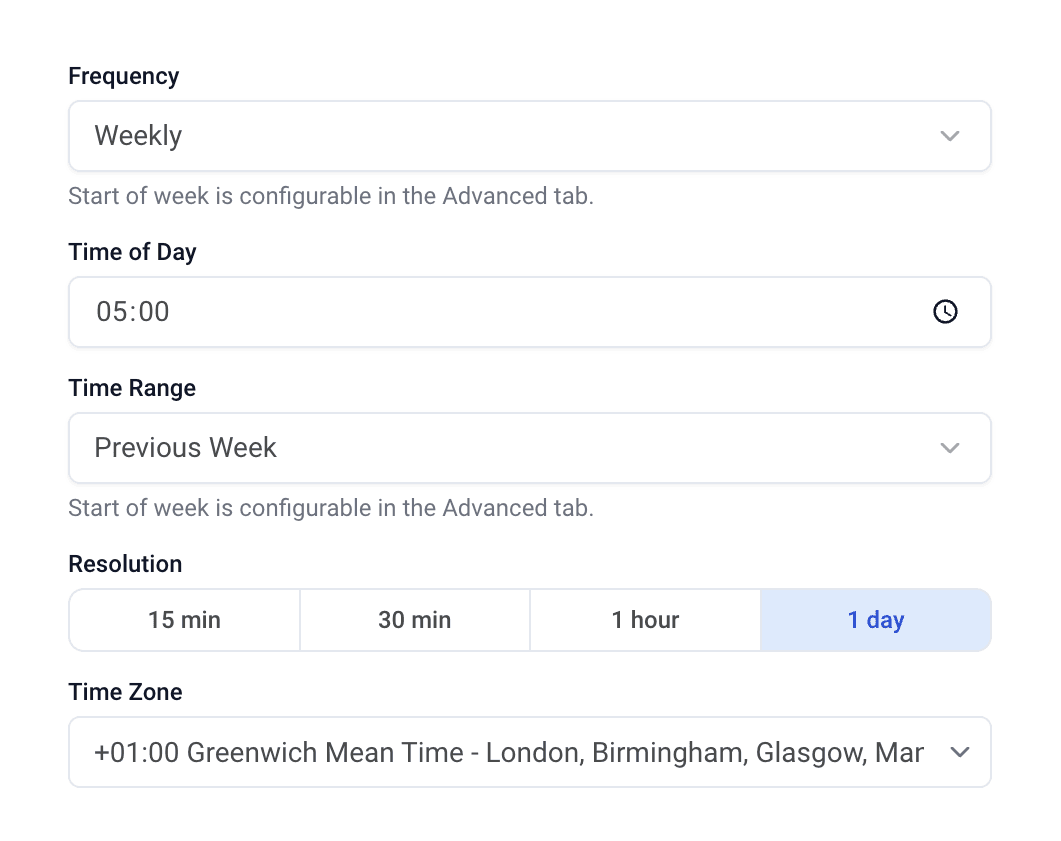
Each report runs on its own recurring schedule and covers the period you define, for example the previous week. The resolution controls how the data is grouped: fine intervals for detailed tables, daily values for a condensed overview.
- Frequency, time of day and time zone per report
- Resolution from 15 minutes to one day
- Start of week on Monday or Sunday
Output & Delivery
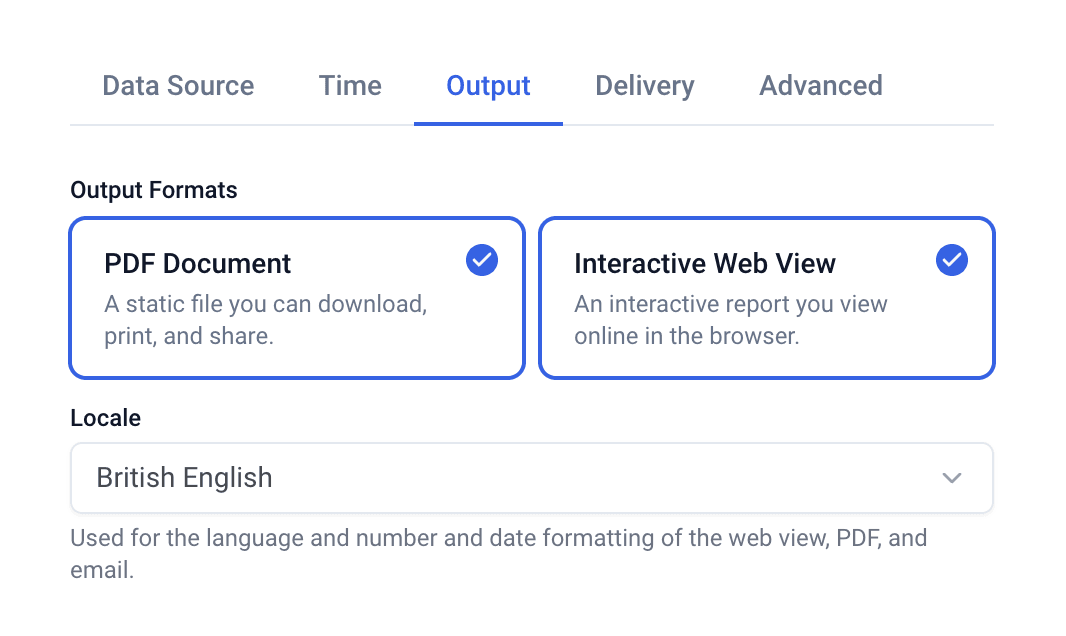
PDF, interactive web view or both
Generate a PDF to download, print and file, a browser-based interactive version, or both. Recipients get an email with a link as soon as the report is ready, optionally with the PDF attached. Reports that leave your organization can be protected with a password.
- Email delivery with a recipient list per report
- Optional PDF attachment and password protection
- Locale sets language, date and number formats
Custom Branding
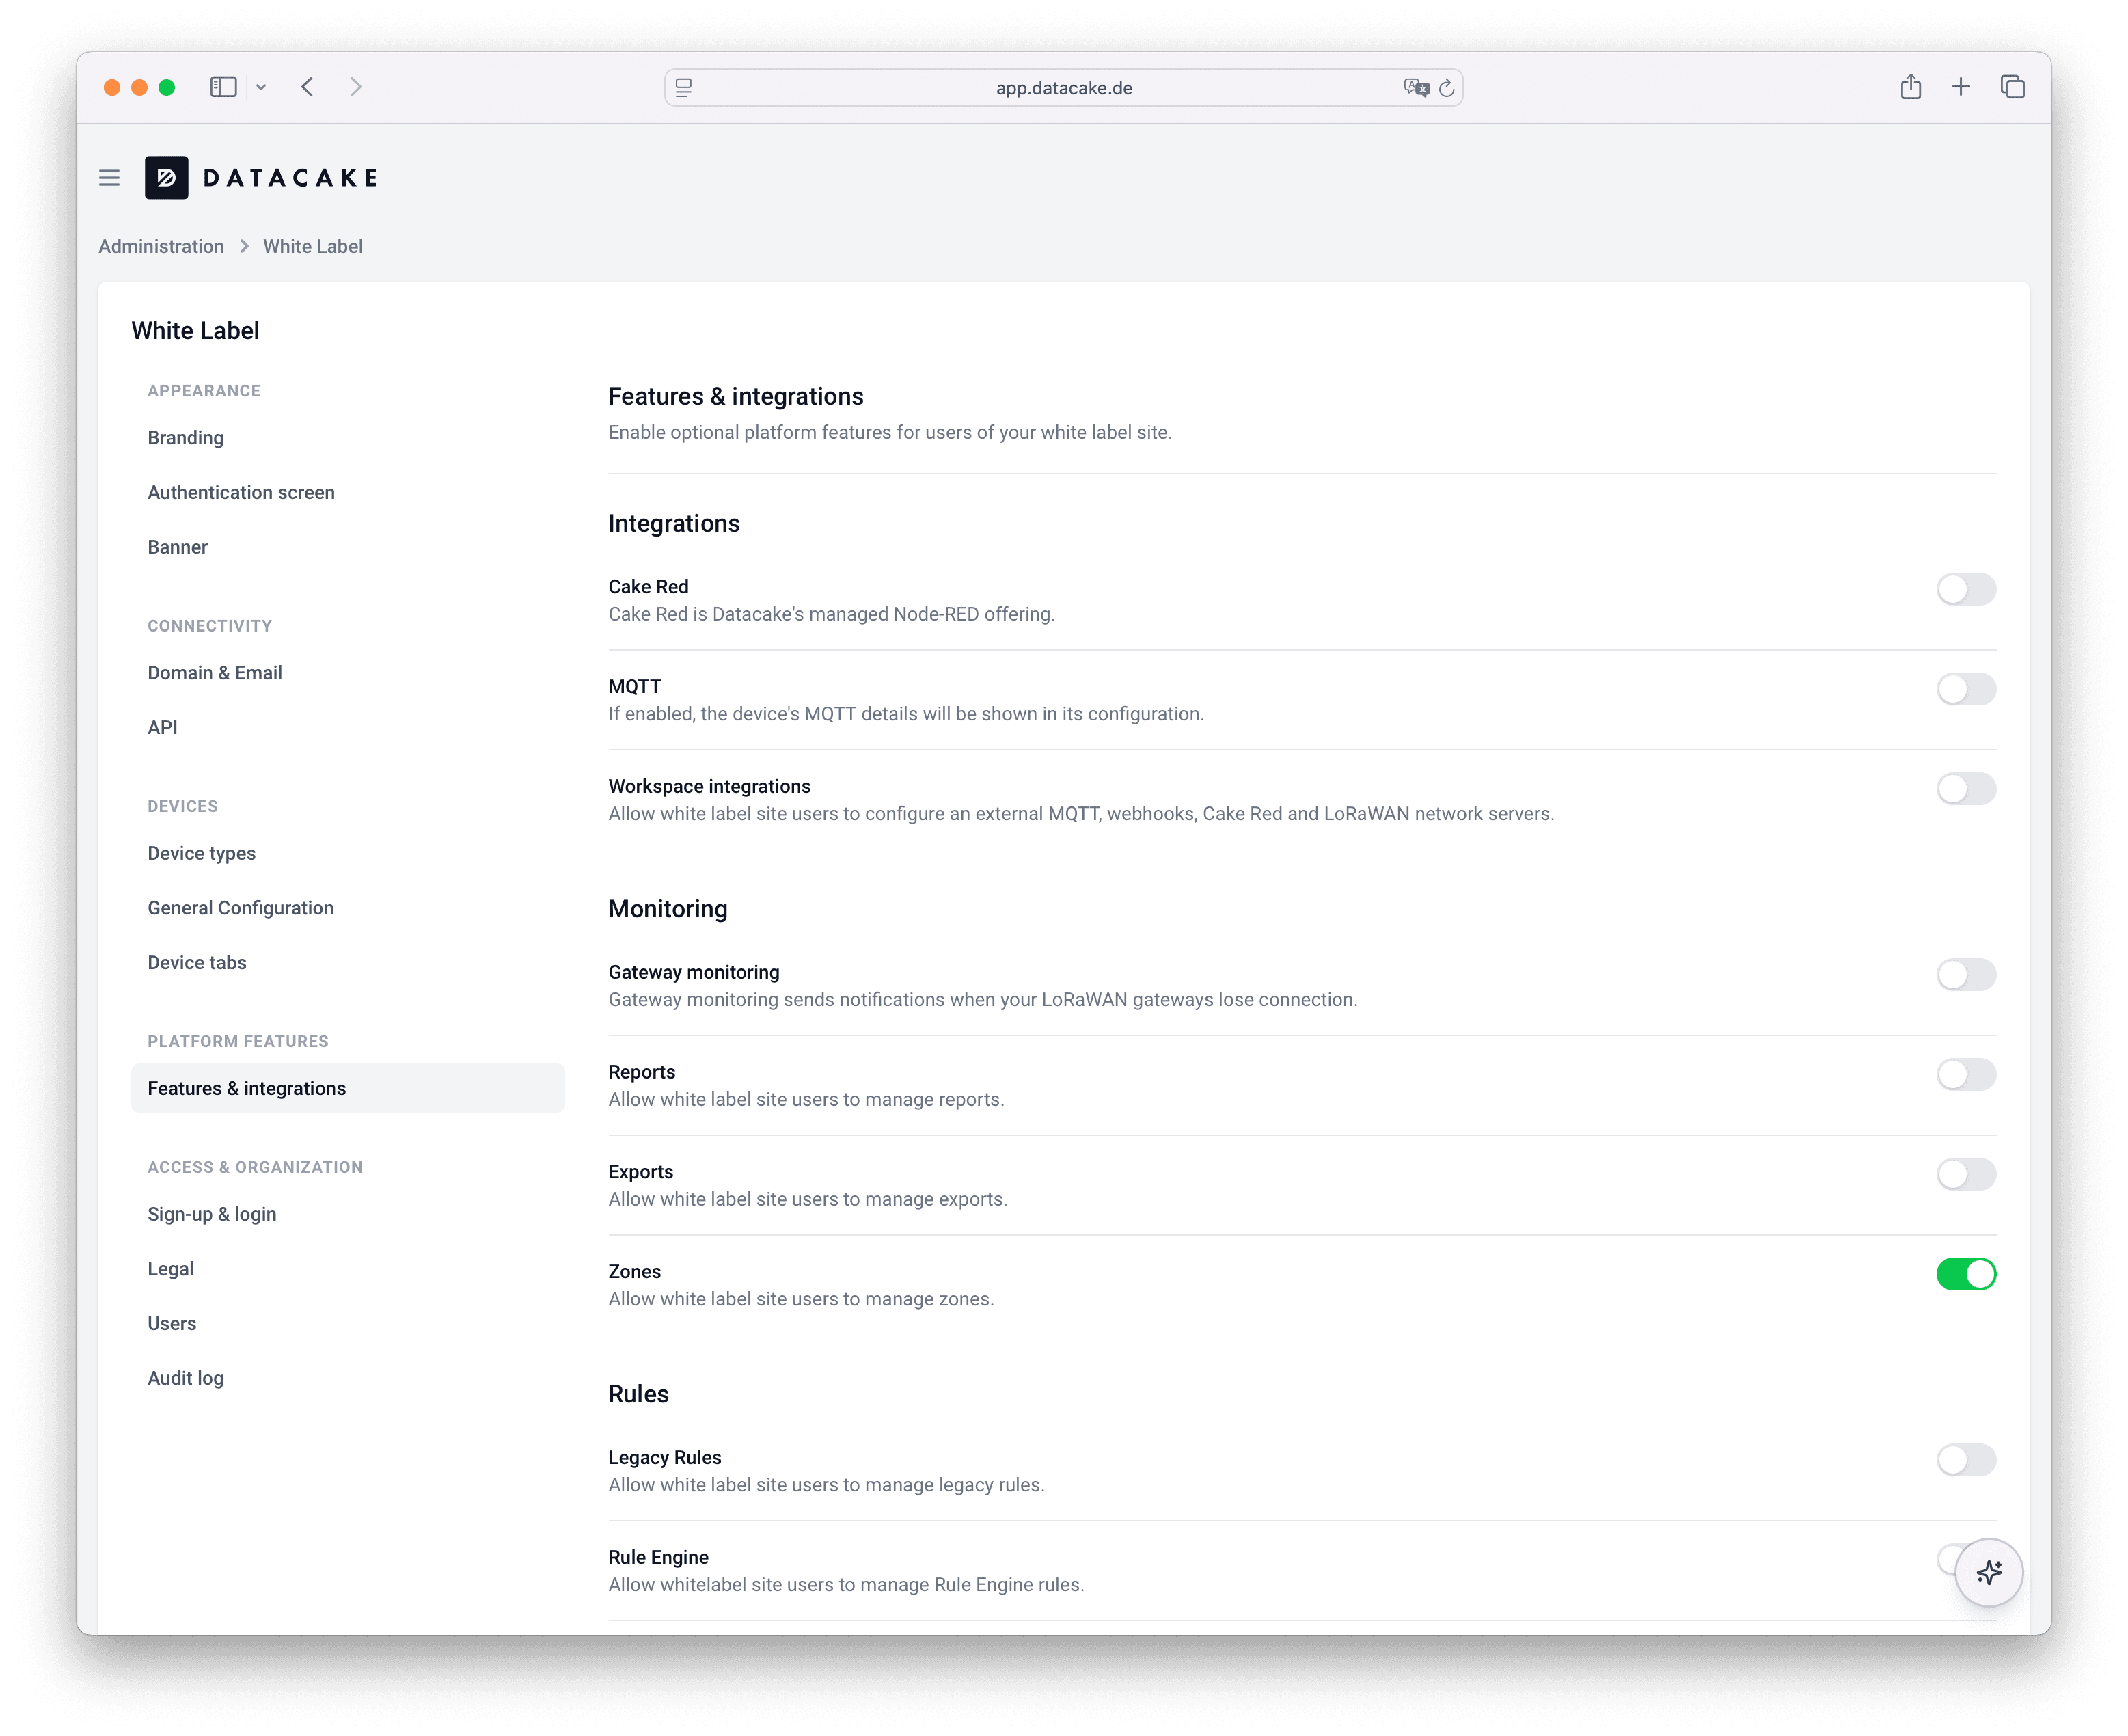
Reports that carry your brand identity
White-label customers can deliver reports under their own brand instead of Datacake's, so the document your customers receive looks like it comes from your own platform.
See white labelStart from a template or a blank page
Cold Chain Monitoring
Temperature and humidity compliance across your cold chain: status table per device or group, excursion list and reviewer sign-off.
Explore the cold chain templateEnergy Consumption
Energy usage trends and consumption analytics, including per-device consumption with start and end meter readings.
From Scratch
Start with a blank canvas and add your own widgets. Works for any numeric field: temperature, CO2, noise, fill levels, energy and more.
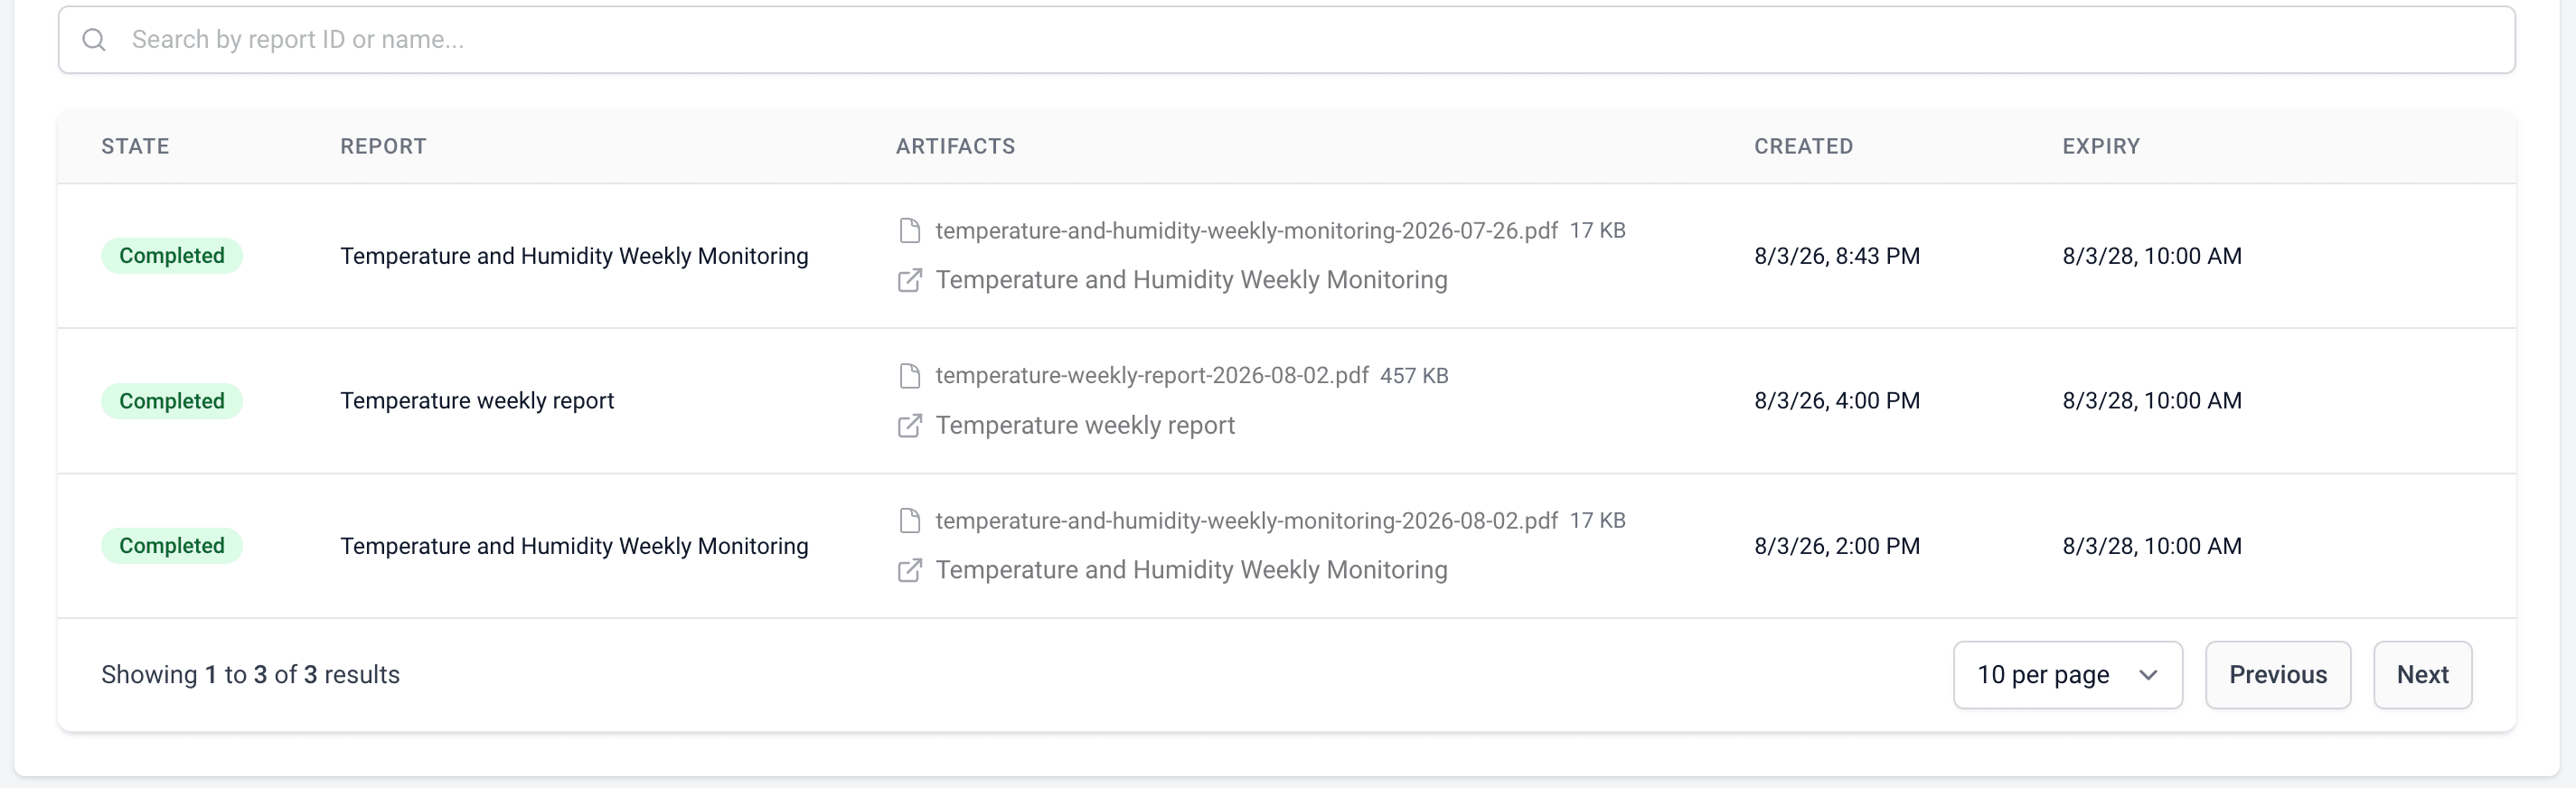
Every generated report in one archive
Each run appears under Generated Reports with its status, the PDF and web view, the creation date and the expiry date. Search by report name or ID to find the document an auditor or customer is asking about.
Report Builder capabilities
Tag-Based Device Selection
Select devices directly or filter them by name and tags, combined with AND or OR. Tag a new device and it joins the next report.
Data Gap Handling
Decide per report how missing measurements are treated: fill forward, interpolate or leave empty. Leaving gaps empty keeps compliance reports to what was actually measured.
Print-Ready Pages
A4 or Letter, portrait or landscape, with forced page breaks wherever a new section should start on a fresh page.
Language & Regional Formats
The locale of a report controls its language and how dates, times and numbers are written in the PDF, the web view and the email.
Password Protection
Require a password to open report links and downloads when reports contain sensitive data or are shared outside your organization.
Workspace-Scoped
Reports are configured per workspace and only contain devices from that workspace, which keeps customer data separated in multi-tenant setups.
Report Builder: frequently asked questions
Last updated: September 2026
Ready to get started?
Create your free account and start monitoring temperature, humidity and air quality in minutes, or book a demo to see how Datacake fits your use case.
Get in touch
We typically reply within one business day.