Indoor Air Quality Monitoring
Healthy air, measured: in every room, every hour
Track CO2, VOCs, fine particulate and humidity across every room of your building. Catch stale-air problems before anyone complains, prove tenant comfort to leadership, and let ventilation run only when it needs to.
- Live CO2, VOC, PM and humidity for every room
- Alerts when air quality slips below your comfort band
- Auto-generated IAQ reports for leadership and tenants
- Demand-controlled ventilation: pay for air you actually use
One dashboard for every room of your building
From a single co-working floor to a school campus or a retail portfolio, Datacake gives facility managers, HR teams and property owners a live view of indoor air quality for every space they are responsible for. Wireless sensors, one gateway, zero IT project.
Where customers deploy IAQ monitoring
Offices & co-working
Keep CO2 under 1,000 ppm in every meeting room. Show staff and prospective tenants that your space is healthy, not just well-lit.
Schools & classrooms
Maintain CO2 levels that support focus and learning. Generate per-classroom reports for teachers, parents and local authorities.
Meeting rooms & event spaces
Auto-trigger ventilation the minute a room fills up. Empty rooms stop wasting conditioned air.
Retail & showrooms
Keep shoppers comfortable with the right humidity and air quality. Track dwell time against comfort indicators.
Restaurants & hospitality
Meet local IAQ regulations, spot kitchen-hood problems early, and deliver guests the comfort they expect.
Gyms & wellness
High-occupancy rooms get hot and stuffy fast. Keep classes comfortable and prove it with data.
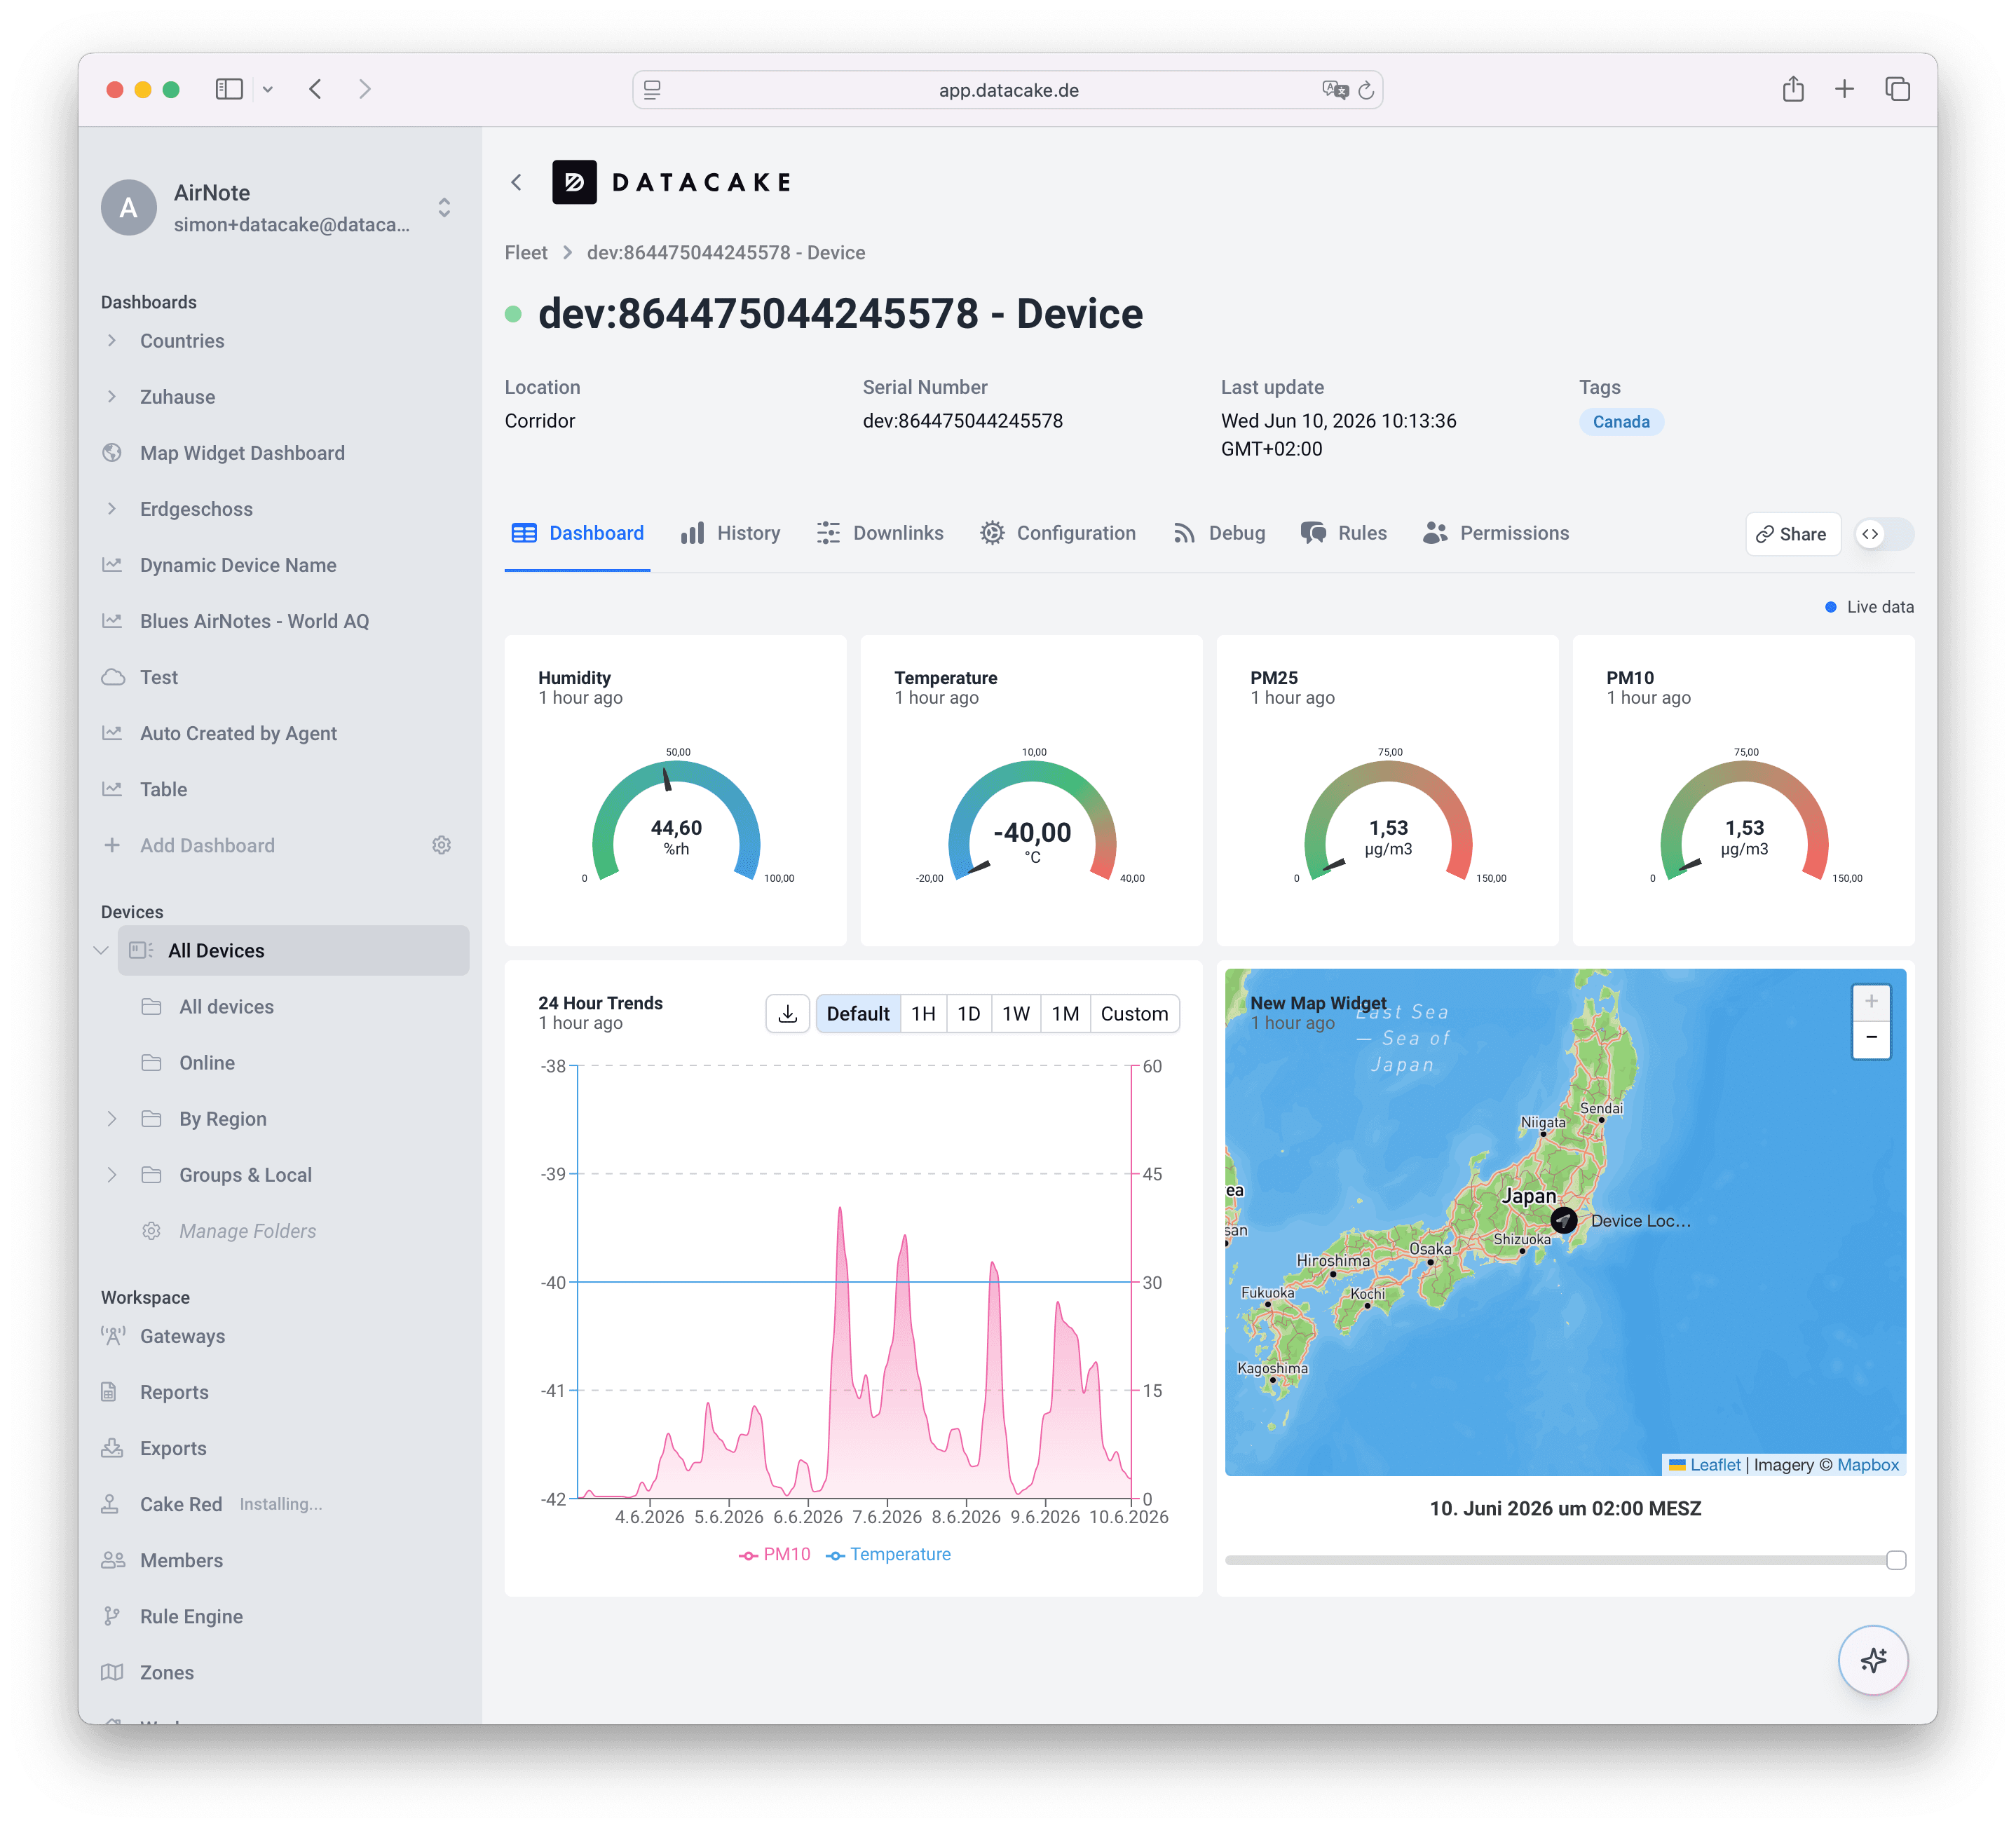
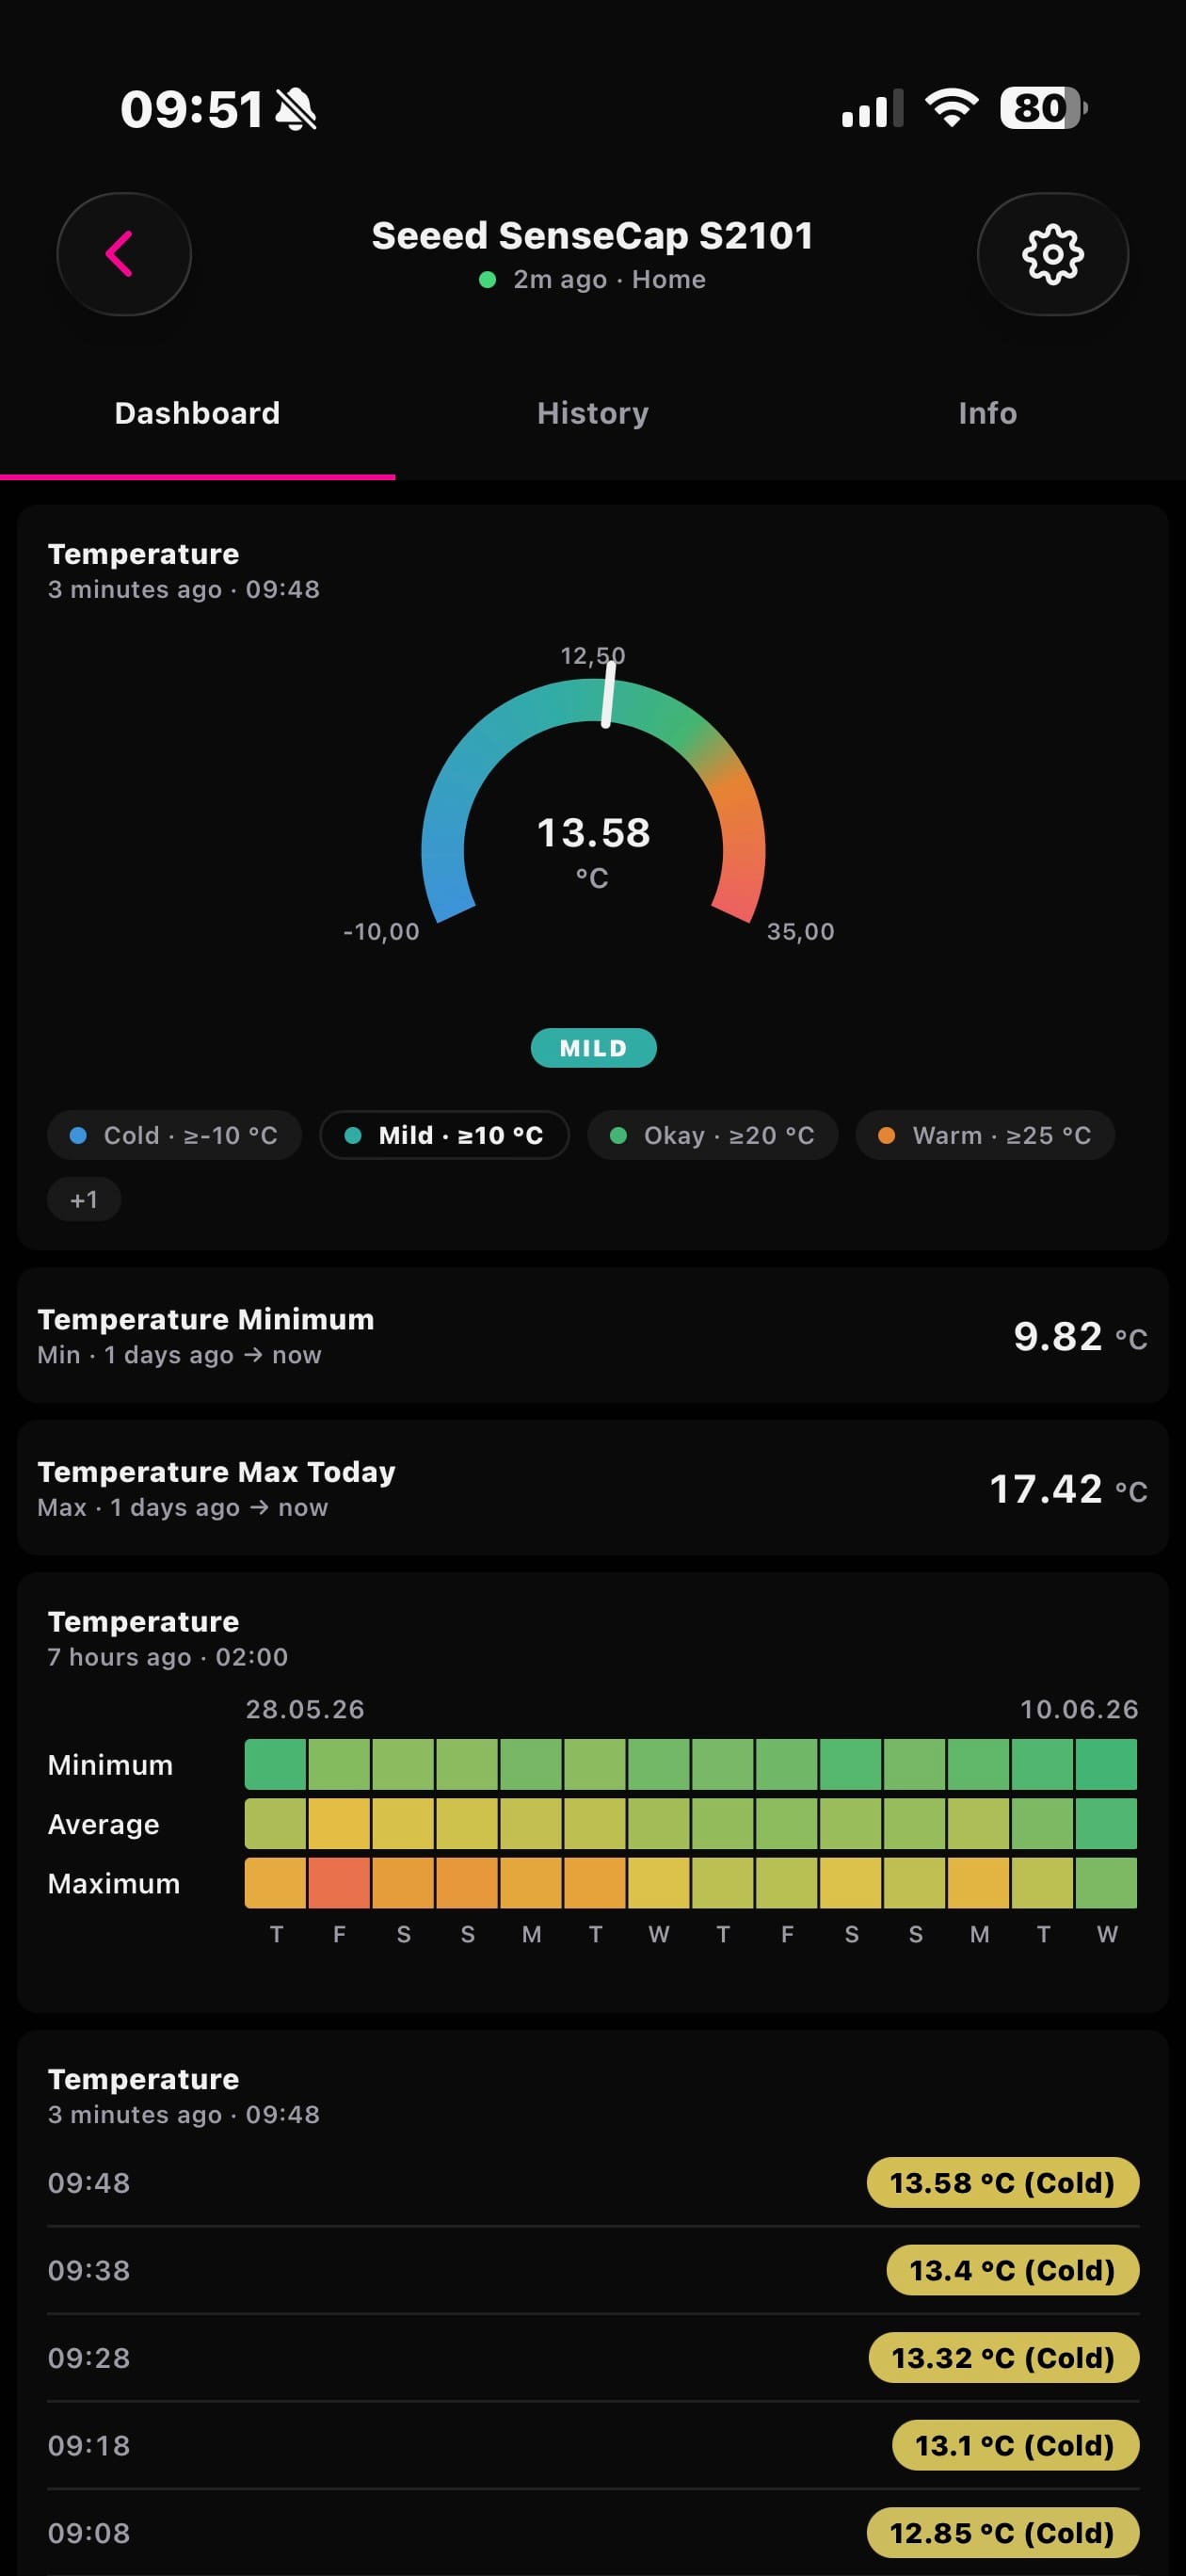
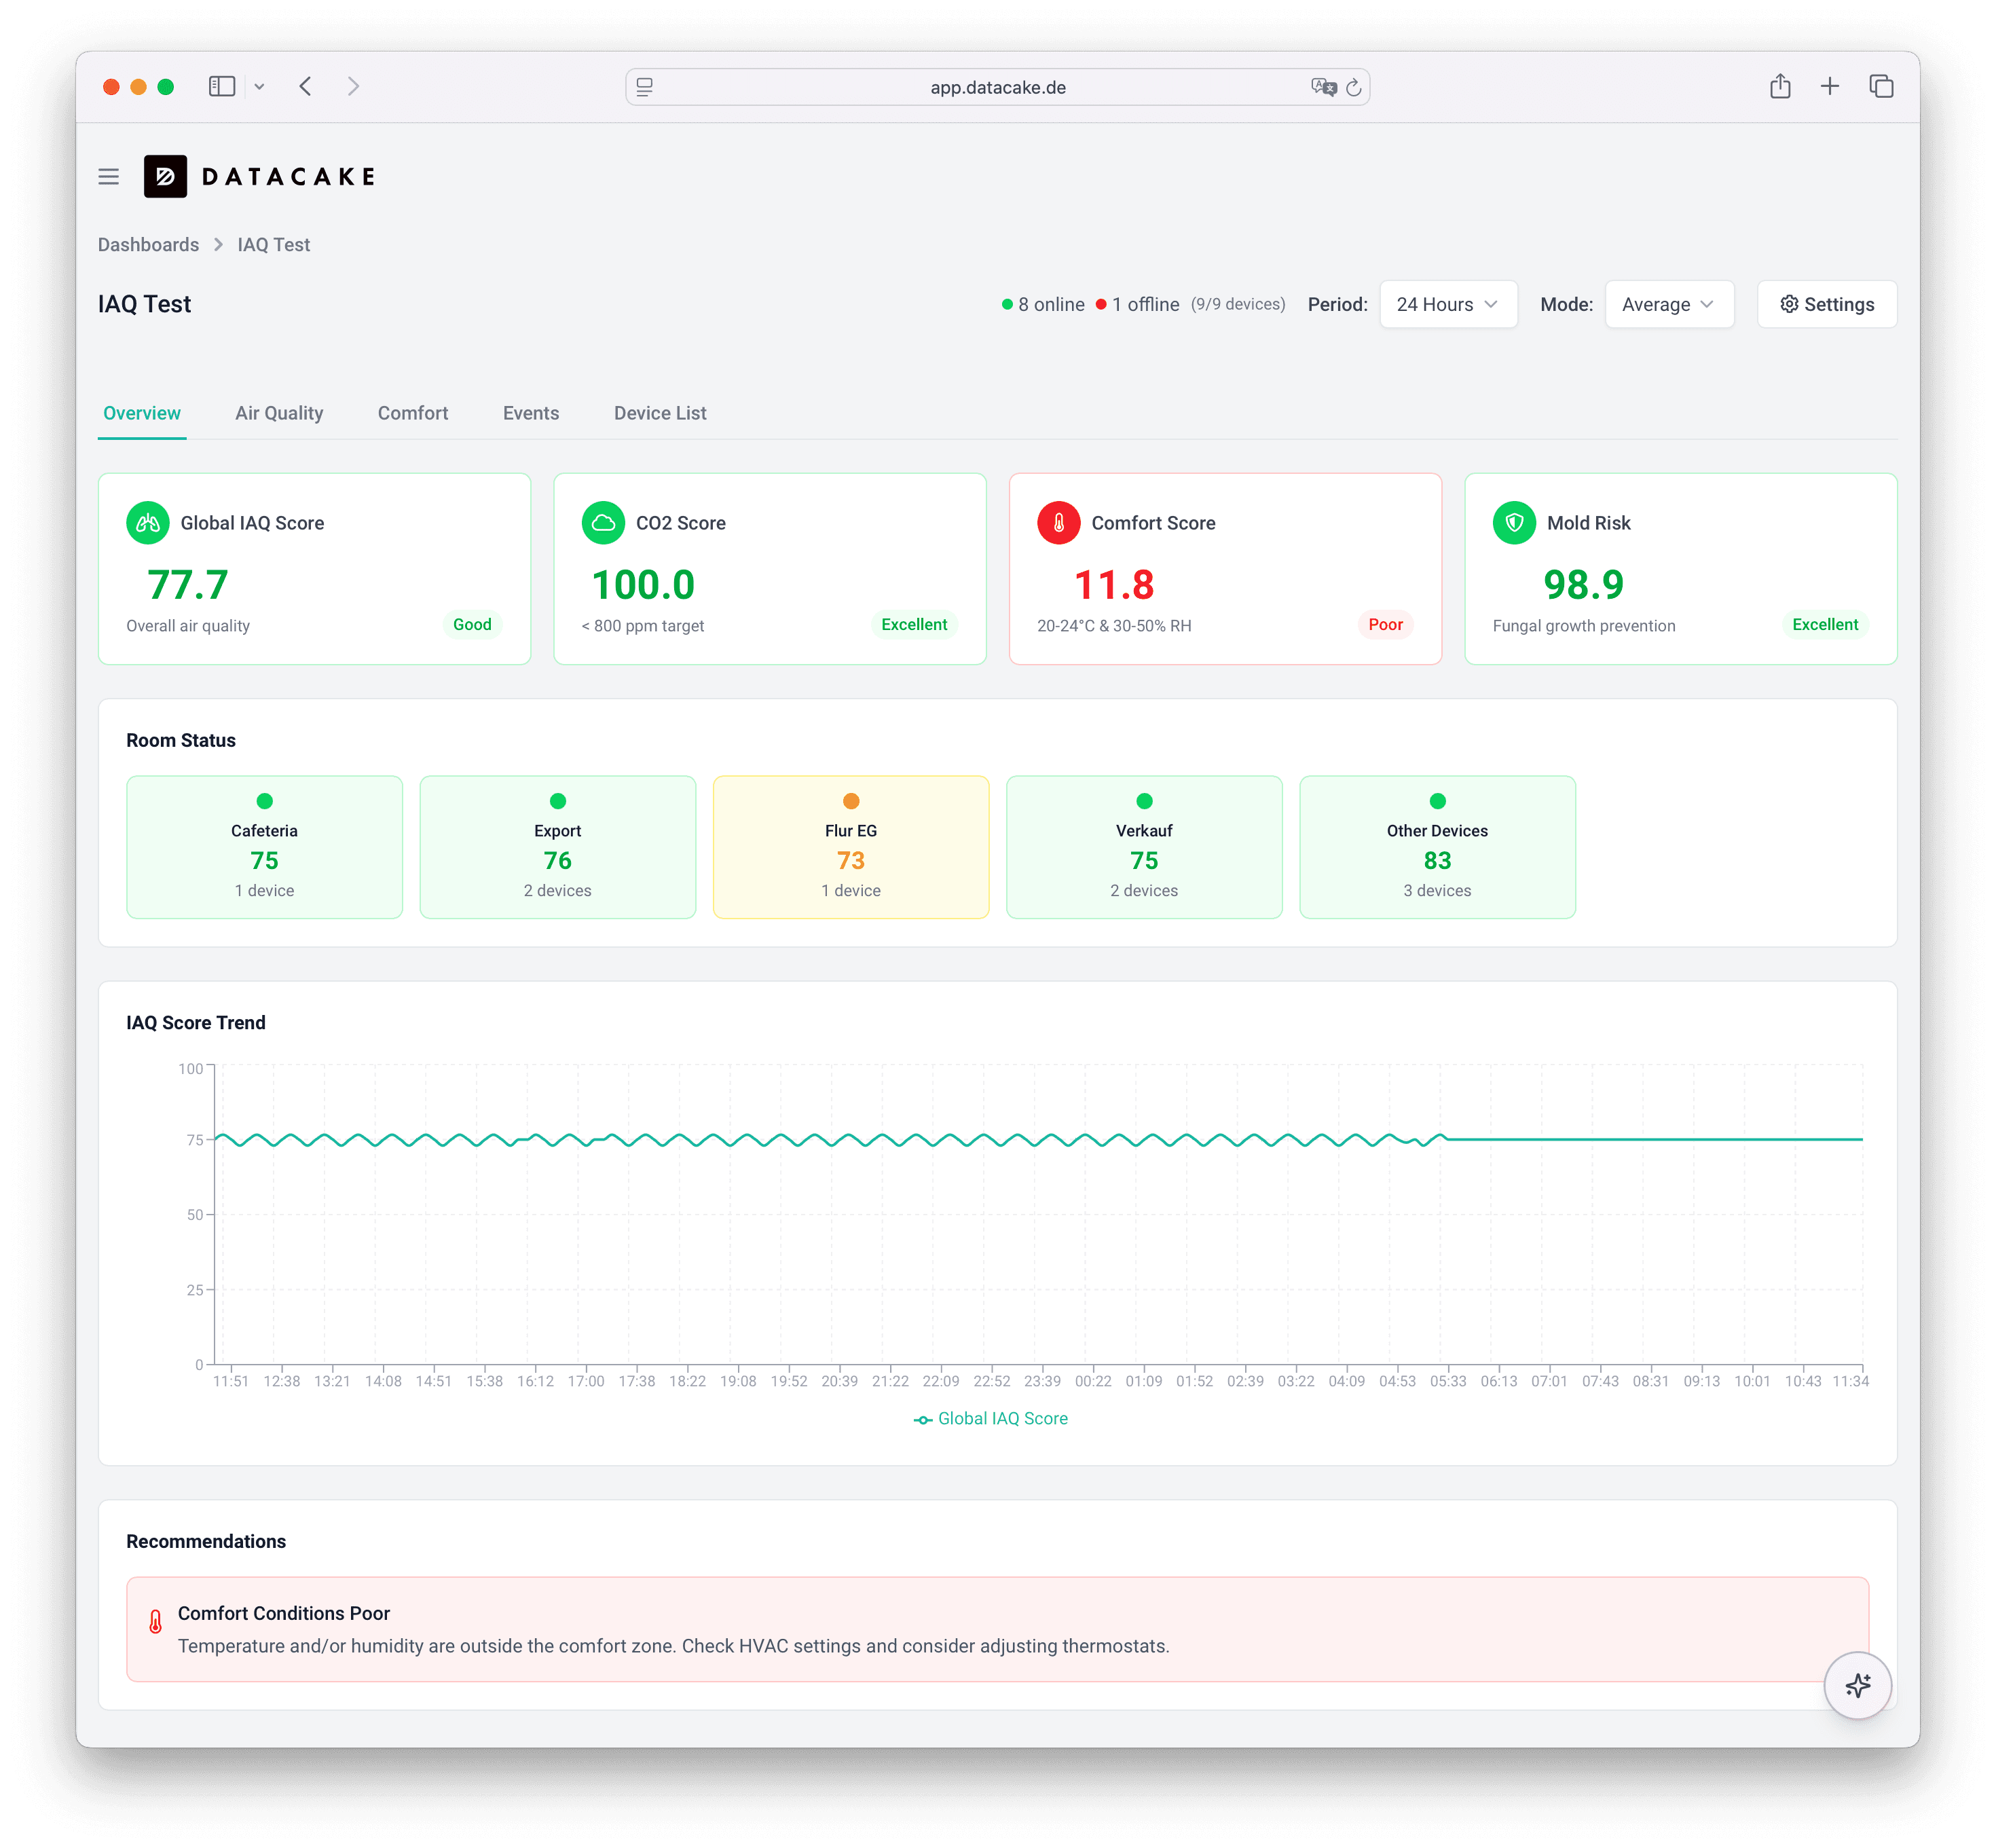
See every room at a glance
One comfort score per room, on one live dashboard
Instead of walking around with a hand-held meter, see every room's IAQ score on one screen. Color-coded floor plans tell you instantly where ventilation is lagging, and where air is great.
- Floor-plan and per-room views in one click
- Aggregated comfort score across CO2, VOC, PM, humidity
- Works for a single building or a portfolio
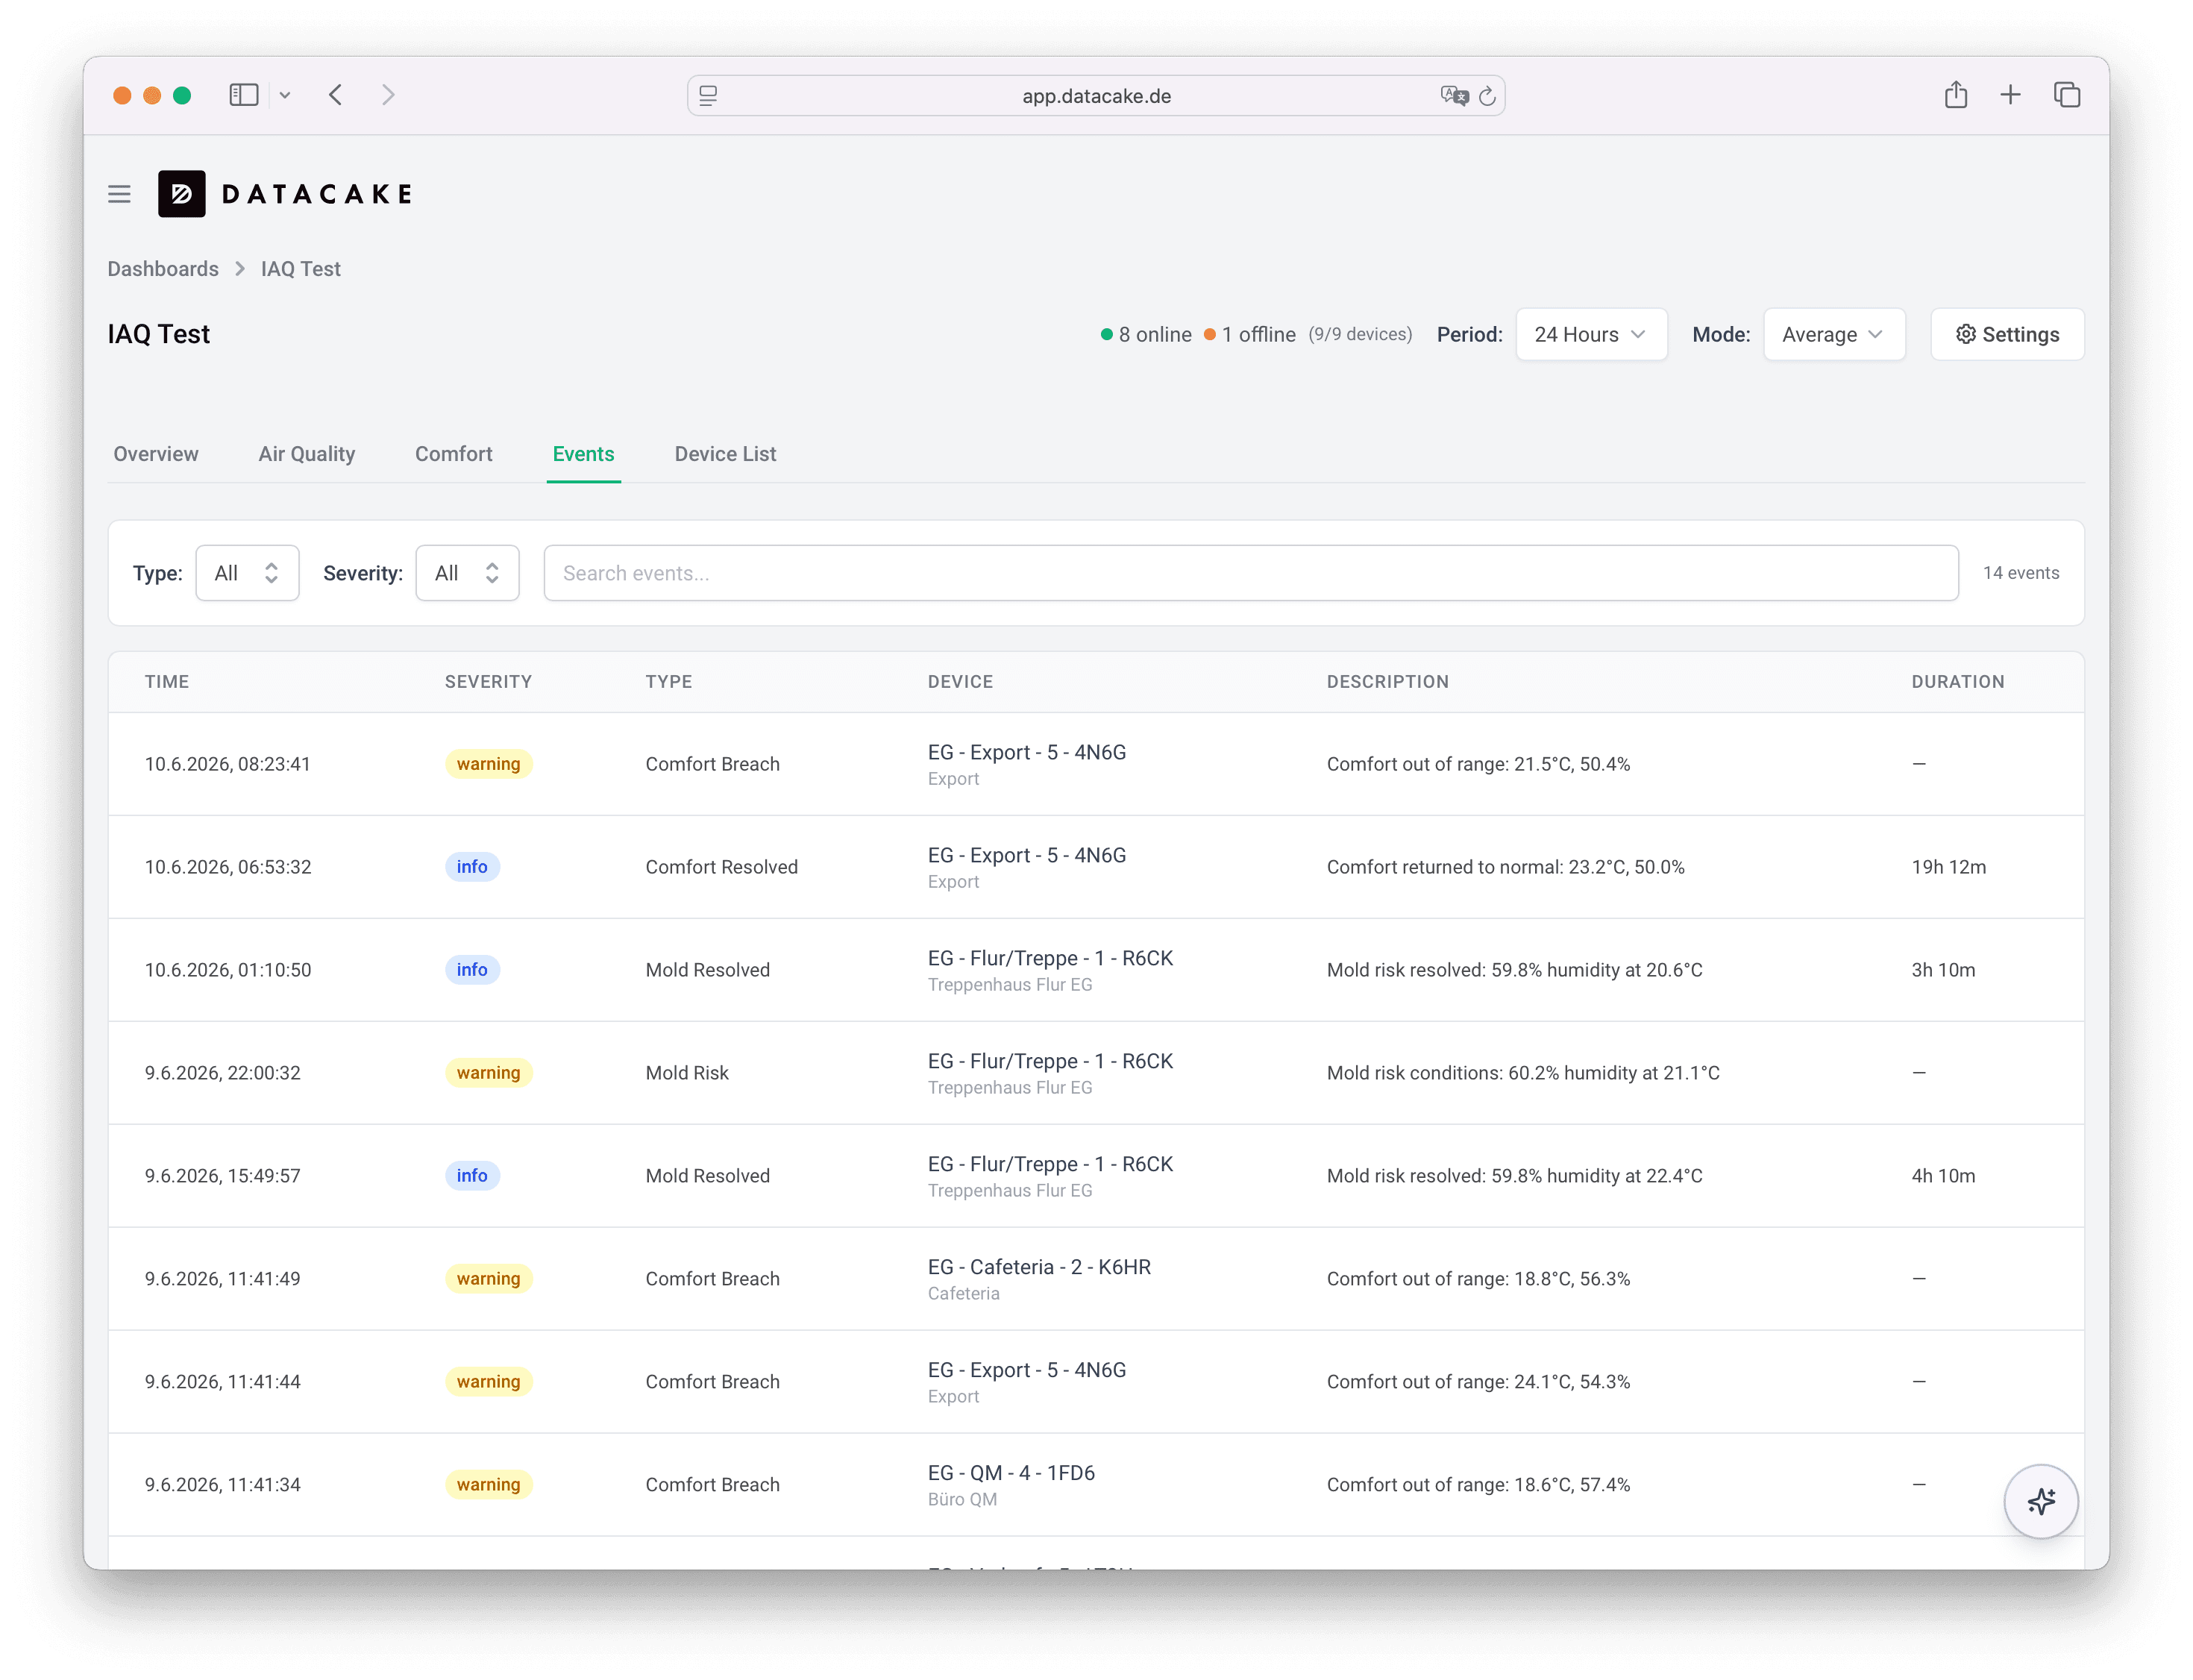
Alert when air quality drops
Catch CO2 spikes and ventilation failures in minutes
Define the thresholds that matter (e.g. ‘CO2 above 1,200 ppm for more than 15 minutes’) and Datacake notifies facilities, teachers or property managers instantly. Alerts acknowledge, escalate and auto-resolve.
- Email, SMS, push and webhook notifications
- Escalation paths for out-of-hours incidents
- Integrate with your BMS or ticketing system
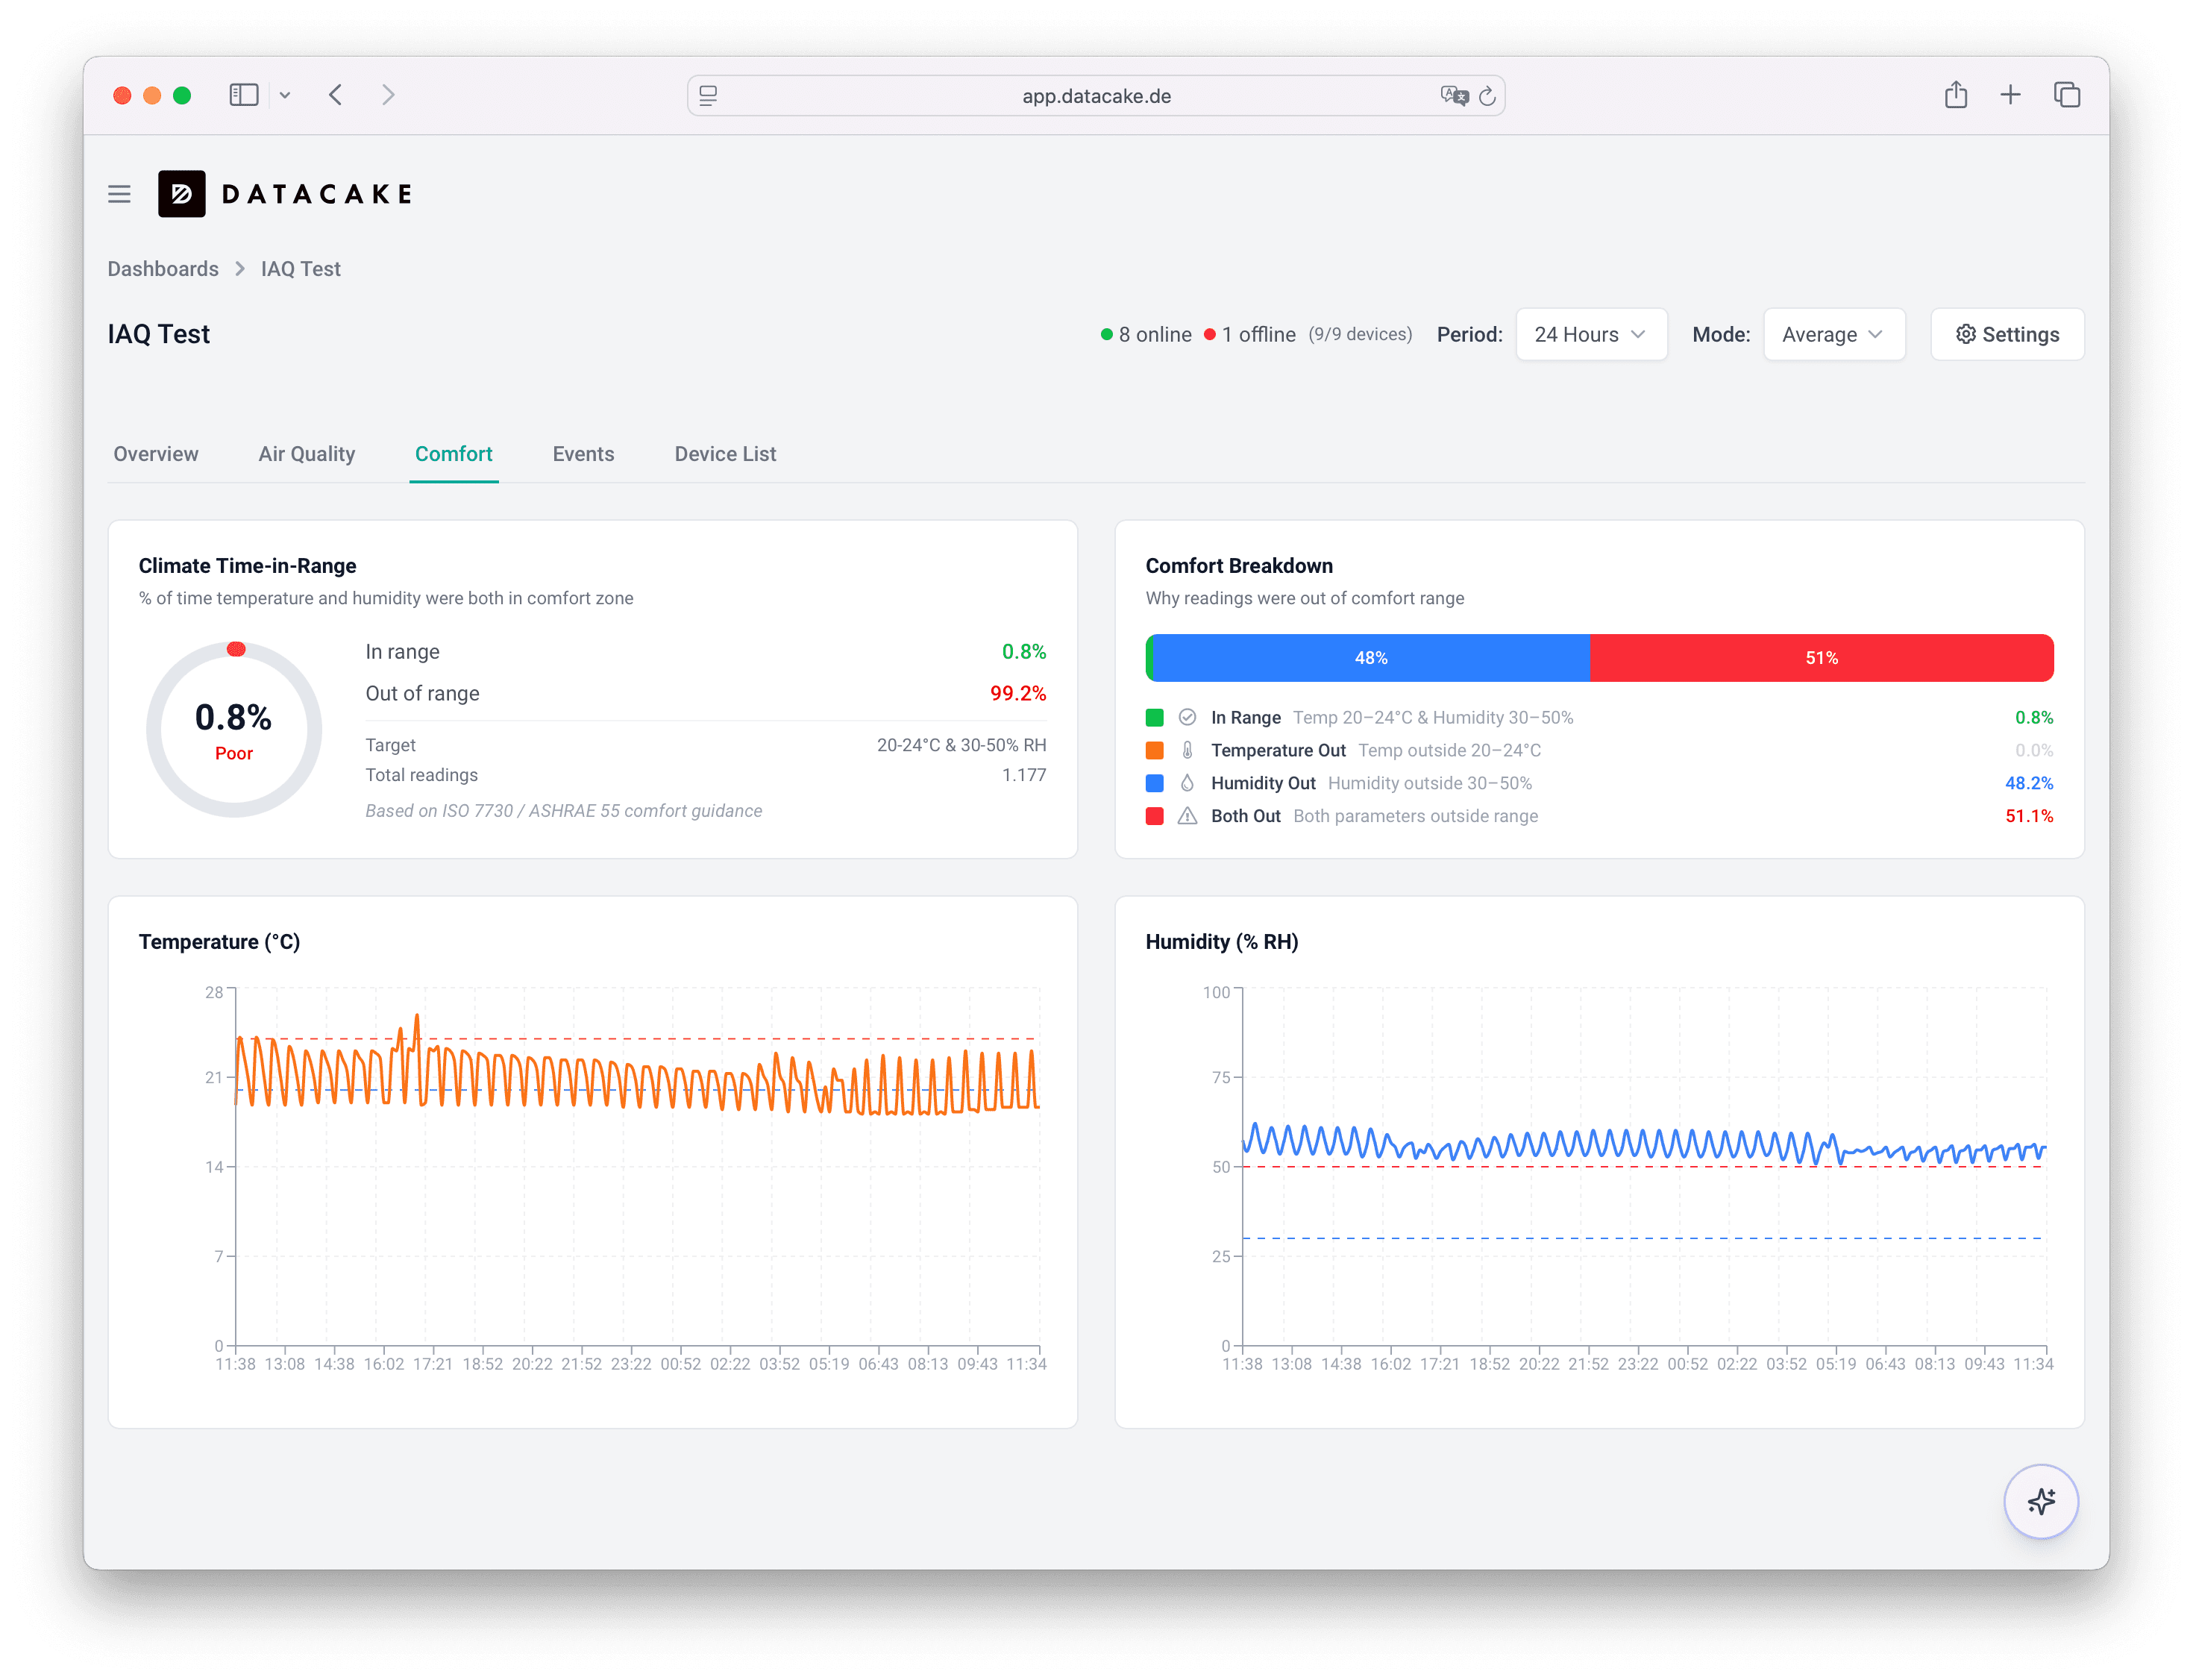
Prove it to leadership and tenants
IAQ reports generated automatically, every week
Turn raw sensor data into reports that executives, HR, tenants and authorities actually read. Weekly PDFs with comfort scores, excursion summaries and ventilation performance, on brand, in your domain.
- Scheduled PDF and Excel reports per building, per zone
- Tenant-facing white-label dashboards
- Export raw data anytime for your own analytics
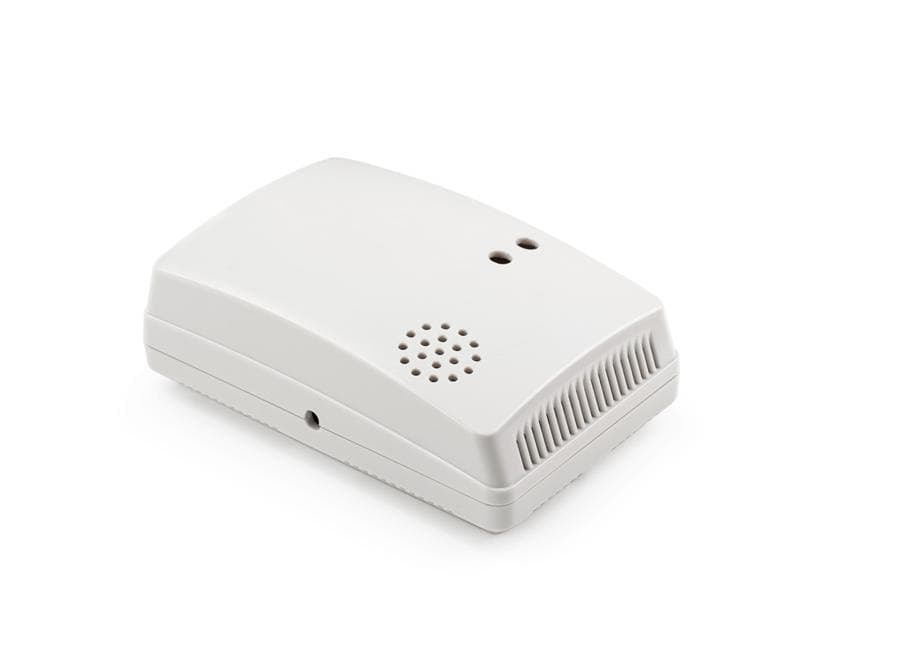
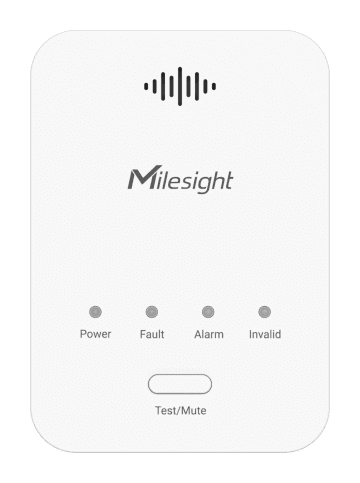
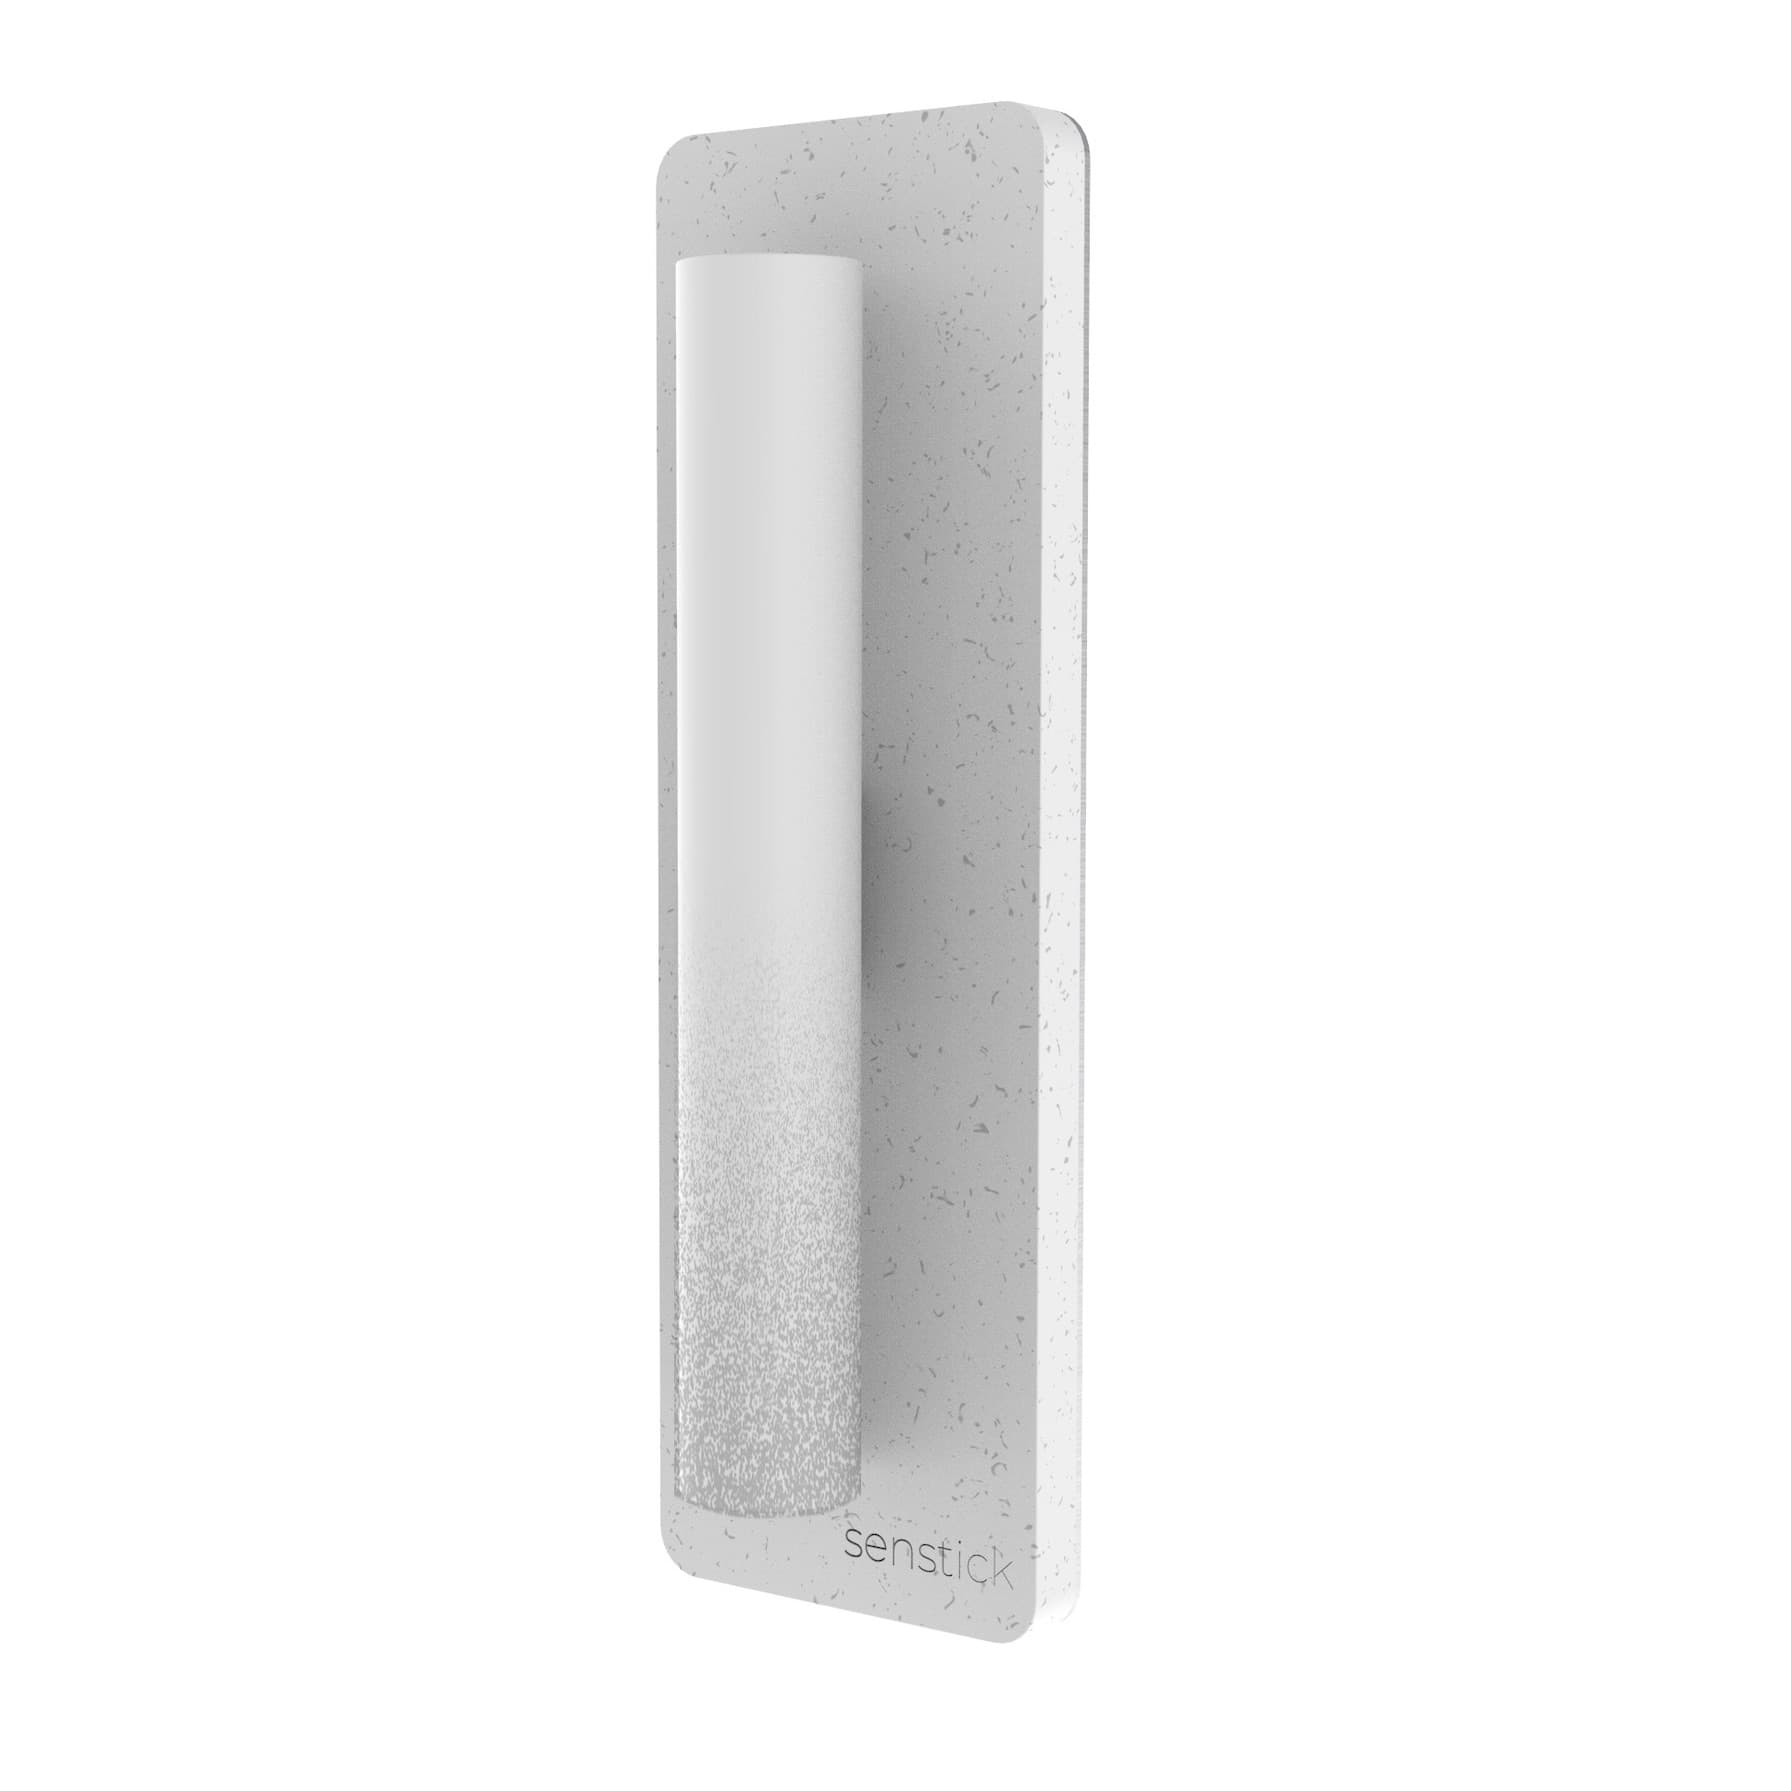
Discrete indoor sensors: no cables, no drilling
One gateway covers a floor or a whole school. Sensors are wall-mounted or desk-placed, battery-powered and wireless.
Compatible LoRaWAN sensor types
Each type links to the full catalog of supported devices; every template ships with a payload decoder and dashboard.


What this pays back
Typical outcomes customers report in the first year. Your figures will depend on building type, occupancy patterns and energy prices. Ask us for a tailored model.
+11%
cognitive performance
Well-documented effect of keeping CO2 below ~1,000 ppm in working and learning spaces.
−20%
ventilation energy
Demand-controlled ventilation stops running HVAC at full tilt in empty rooms.
Fewer
sick days
Healthier air correlates with fewer absences and complaints.
+Happy
tenants & staff
Proof-of-comfort dashboards boost satisfaction and retention.
Example based on a 1,500 m² office with 20 sensors and standard German workweek occupancy. Figures reference anonymized Datacake customer outcomes and published academic findings.
Powered by Datacake platform features
Want to understand how this works under the hood? Here are the platform features that make it possible.
Trusted across these industries
Teams in these industries already run this monitoring pattern in production with Datacake. Pick yours for industry-specific use cases and customer stories.

Industrial Facilities
Climate, air, noise and energy: the whole plant on one wireless dashboard.
Explore industry
Museums & Archives
Protect irreplaceable artifacts: climate, humidity and air quality, continuously verified.
Explore industry
Schools & Education
Healthy air, focused minds: CO2, humidity and temperature across every classroom.
Explore industryReady to get started?
Create your free account and start monitoring temperature, humidity and air quality in minutes, or book a demo to see how Datacake fits your use case.
Get in touch
We typically reply within one business day.